Copyright
©The Author(s) 2024.
World J Diabetes. Jun 15, 2024; 15(6): 1340-1352
Published online Jun 15, 2024. doi: 10.4239/wjd.v15.i6.1340
Published online Jun 15, 2024. doi: 10.4239/wjd.v15.i6.1340
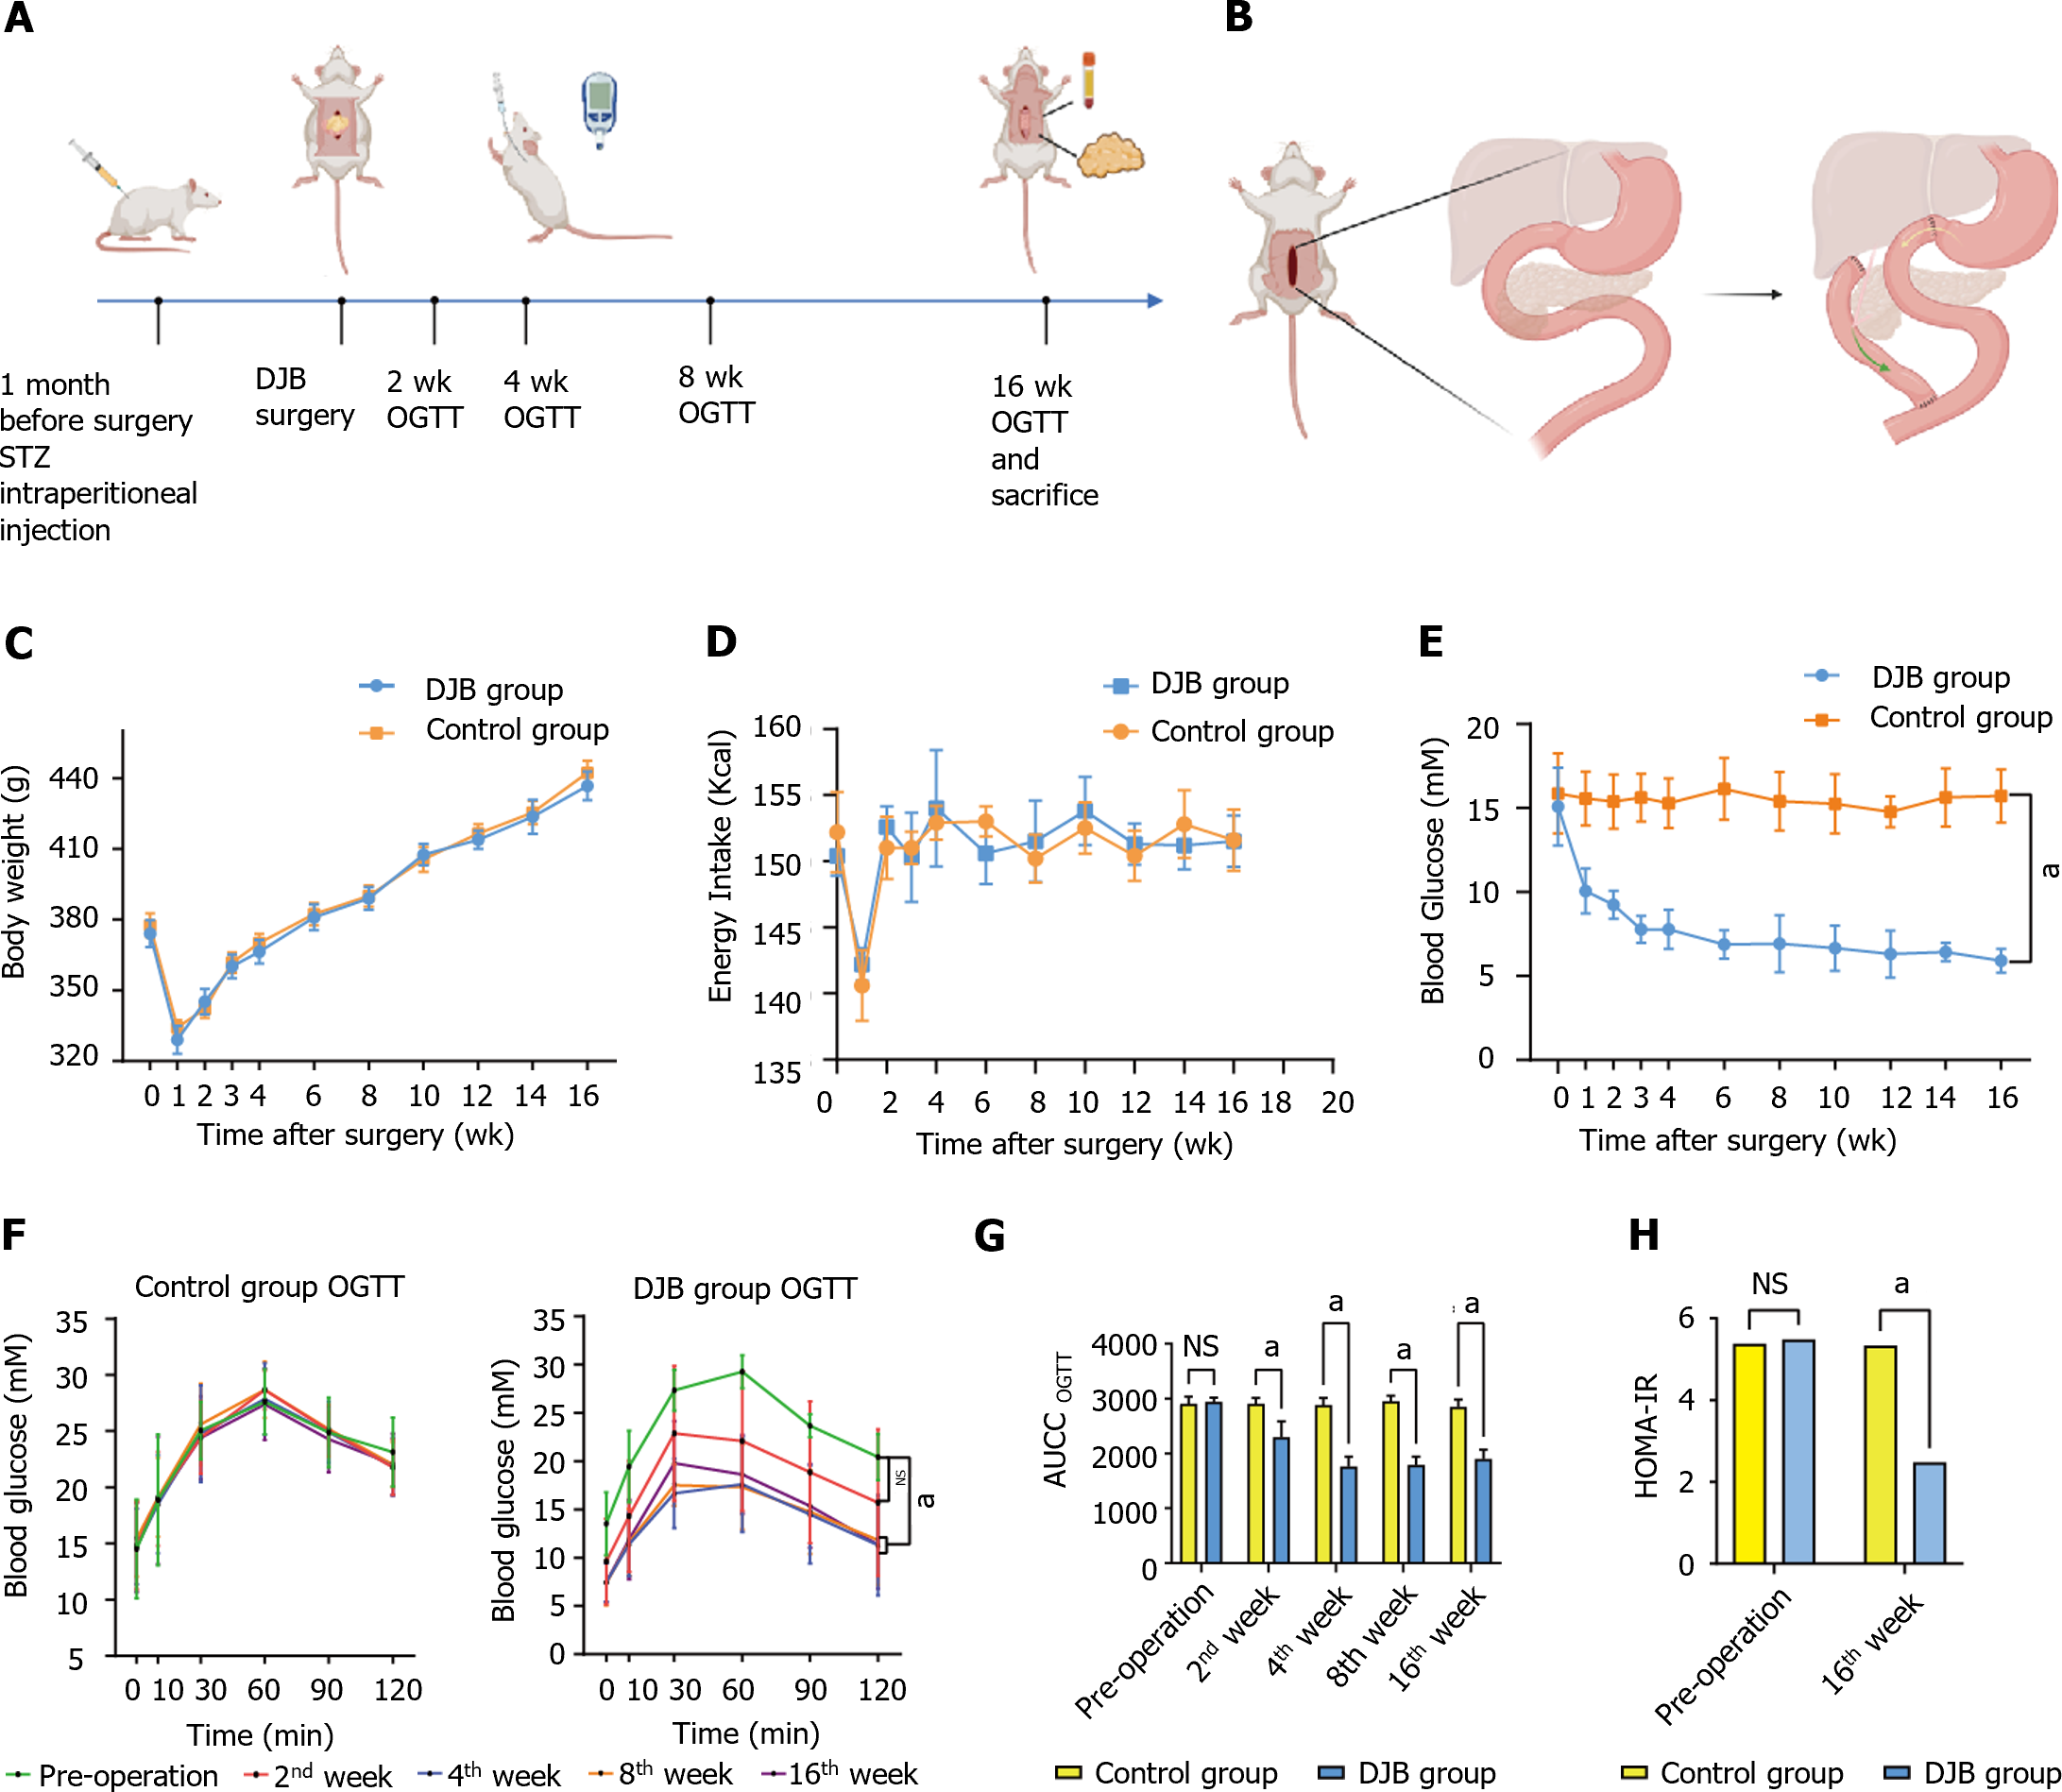
Figure 1 Body weight, energy intake and glucose metabolism of duodenal-jejunal bypass and control groups.
A: Schematic timeline of experiment; B: Schematic of duodenal-jejunal bypass (DJB) surgery; C: Body weight; D: Energy intake; E: Fasting blood glucose; F: Oral glucose tolerance test (OGTT) of DJB and control group; G: Area under curve for OGTT; H: Homeostasis model of assessment for insulin resistance of DJB and control group. Control vs DJB, aP < 0.001 or ns = not significant. STZ: Streptozotocin; OGTT: Oral glucose tolerance test; DJB: Duodenal-jejunal bypass; HOMA-IR: Homeostasis model of assessment for insulin resistance; AUC: Area under curve.
- Citation: Liu ZT, Yang GW, Zhao X, Dong SH, Jiao Y, Ge Z, Yu A, Zhang XQ, Xu XZ, Cheng ZQ, Zhang X, Wang KX. Growth hormone improves insulin resistance in visceral adipose tissue after duodenal-jejunal bypass by regulating adiponectin secretion. World J Diabetes 2024; 15(6): 1340-1352
- URL: https://www.wjgnet.com/1948-9358/full/v15/i6/1340.htm
- DOI: https://dx.doi.org/10.4239/wjd.v15.i6.1340


