Copyright
©The Author(s) 2024.
World J Diabetes. May 15, 2024; 15(5): 977-987
Published online May 15, 2024. doi: 10.4239/wjd.v15.i5.977
Published online May 15, 2024. doi: 10.4239/wjd.v15.i5.977
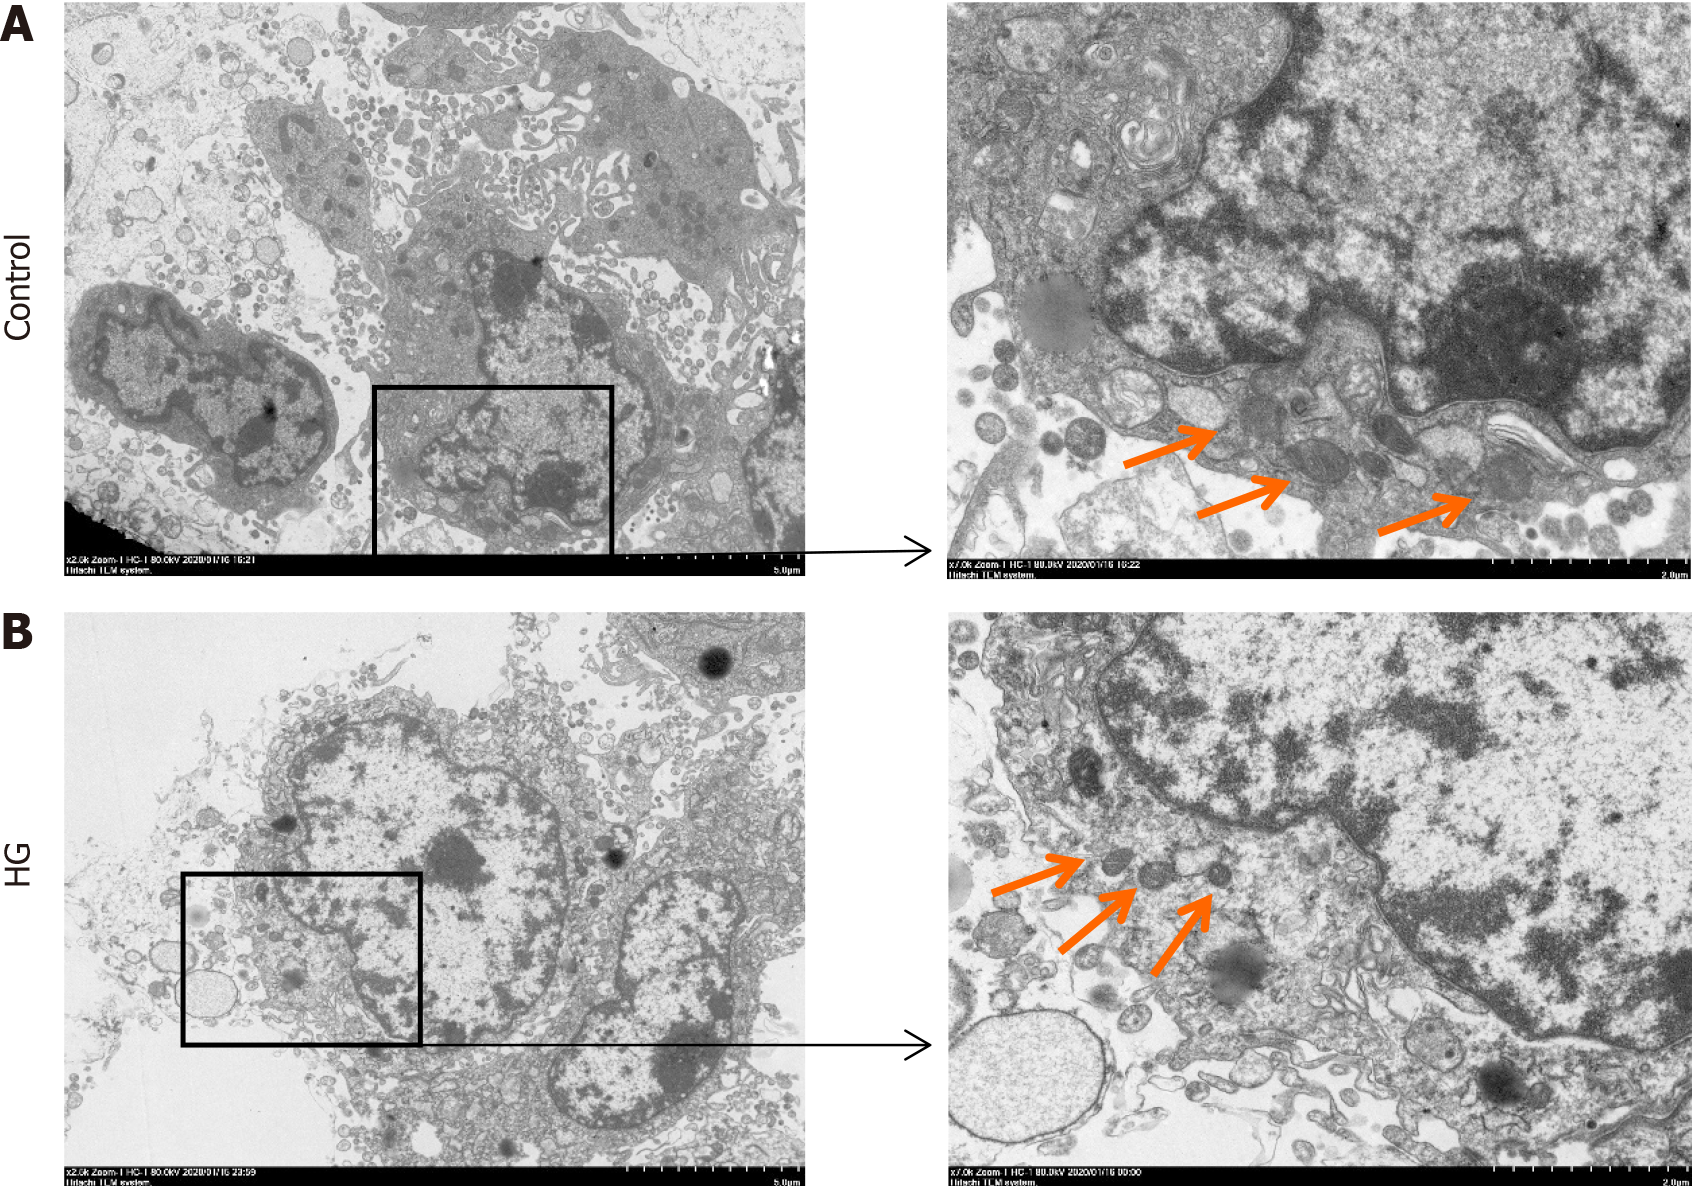
Figure 2 Observation of mitochondrial changes in osteoblasts in a high glucose environment using electron microscopy.
A: In the control group, the mitochondria in the osteoblasts were normal and the ridge lines were clear; B: In the high glucose group, the mitochondria in the osteoblasts were fused and shrunken, and the staining was deeper. HG: High glucose.
- Citation: Ma HD, Shi L, Li HT, Wang XD, Yang MW. Polycytosine RNA-binding protein 1 regulates osteoblast function via a ferroptosis pathway in type 2 diabetic osteoporosis. World J Diabetes 2024; 15(5): 977-987
- URL: https://www.wjgnet.com/1948-9358/full/v15/i5/977.htm
- DOI: https://dx.doi.org/10.4239/wjd.v15.i5.977


