Copyright
©The Author(s) 2024.
World J Diabetes. May 15, 2024; 15(5): 977-987
Published online May 15, 2024. doi: 10.4239/wjd.v15.i5.977
Published online May 15, 2024. doi: 10.4239/wjd.v15.i5.977
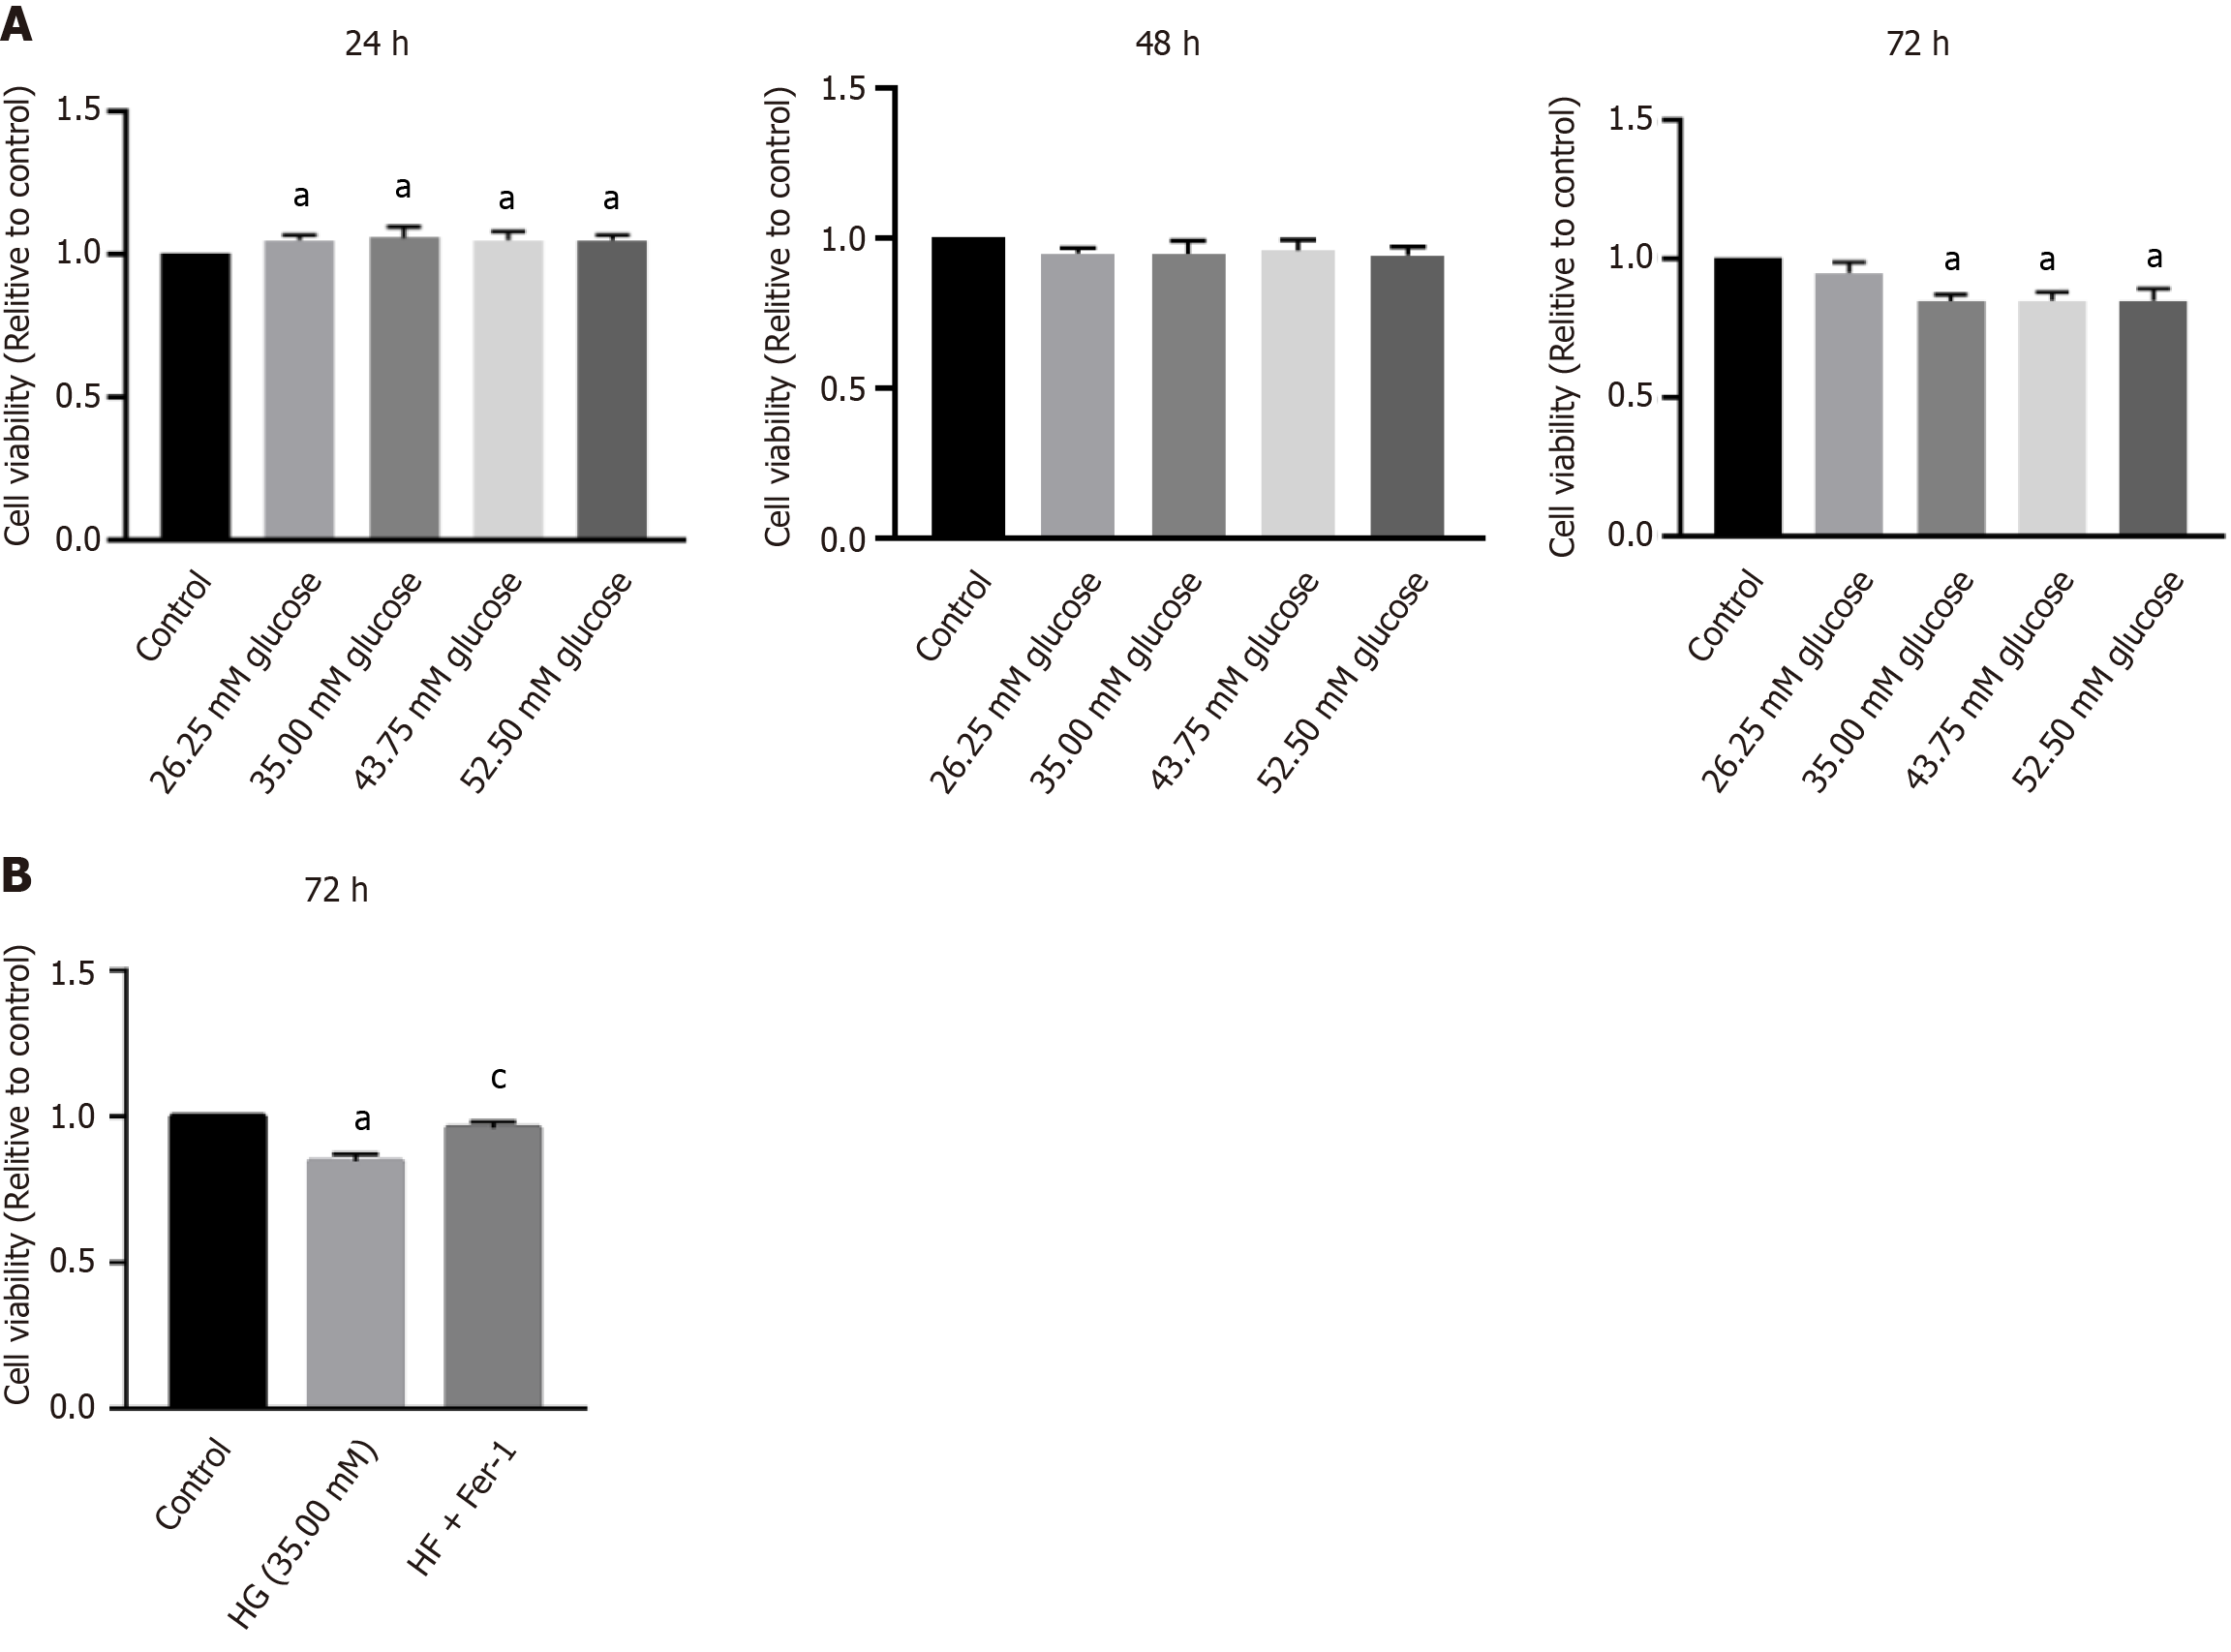
Figure 1 Detection of osteoblast activity after the addition of different glucose concentrations at different time points.
A: Osteoblasts considerably reduced in activity after 72 h in glucose concentrations ≥ 35 mmol/L; B: Osteoblasts treated with high glucose (HG) combined with Fer-1 showed increased activity compared with those in the HG group. Data are presented as mean ± SD. aP < 0.05 vs control; cP < 0.05 vs HG. HG: High glucose.
- Citation: Ma HD, Shi L, Li HT, Wang XD, Yang MW. Polycytosine RNA-binding protein 1 regulates osteoblast function via a ferroptosis pathway in type 2 diabetic osteoporosis. World J Diabetes 2024; 15(5): 977-987
- URL: https://www.wjgnet.com/1948-9358/full/v15/i5/977.htm
- DOI: https://dx.doi.org/10.4239/wjd.v15.i5.977


