Copyright
©The Author(s) 2024.
World J Diabetes. May 15, 2024; 15(5): 958-976
Published online May 15, 2024. doi: 10.4239/wjd.v15.i5.958
Published online May 15, 2024. doi: 10.4239/wjd.v15.i5.958
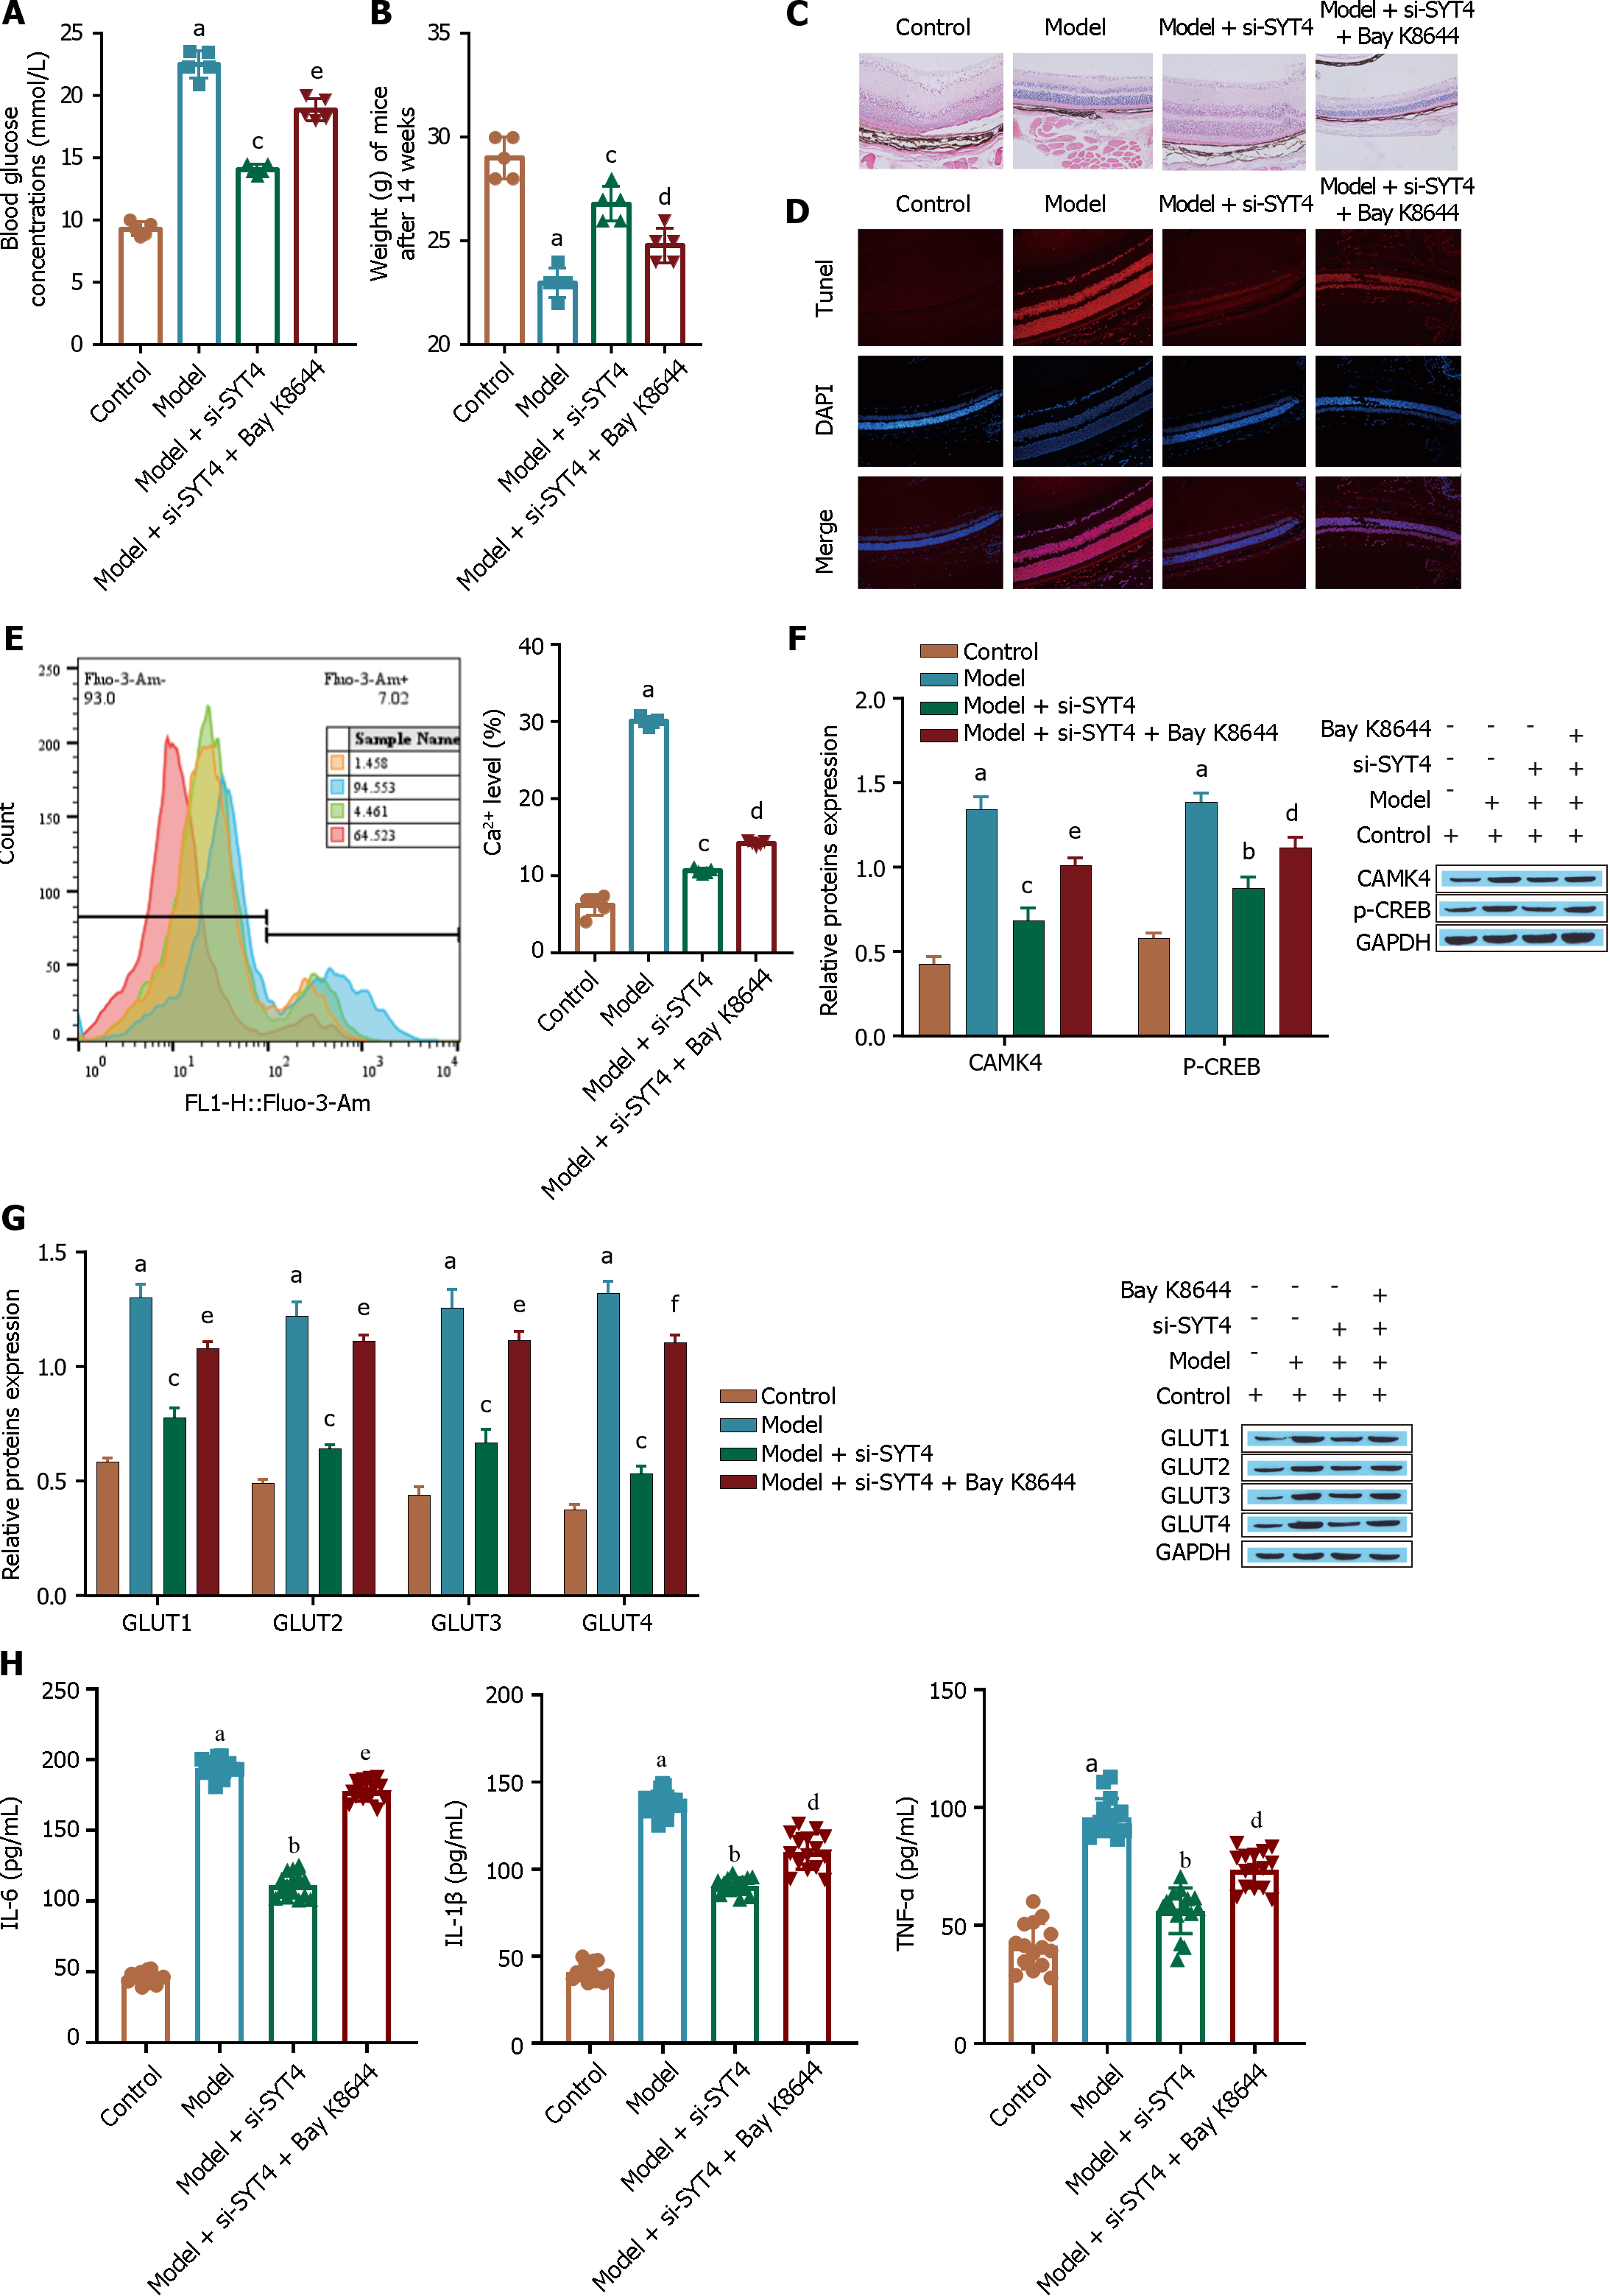
Figure 8 Animal experiment to verify the inhibition of diabetic retinopathy by synaptotagmins 4 knockdown.
A: A kit was used to measure the blood glucose levels of the mice; B: Electronic weighing was used to evaluate the mice; C: HE staining was used to observe retinal structure; D: TUNEL staining was performed to evaluate cell apoptosis; E: Flow cytometry was used to determine Ca2+ levels; F: Western blot was used to detect the Ca2+ signaling pathway-related proteins CAMK4 and p-CREB; G: The glucose transporter was detected via Western blot; H: The levels of inflammatory cytokines [tumour necrosis factor alpha, interleukin (IL)-1β, and IL-6] were measured via ELISA. aP < 0.001, vs the control group; bP < 0.01, cP < 0.001 vs the model group; dP < 0.05, eP < 0.01, fP < 0.001 vs the model + si- synaptotagmins 4 group. SYT: Synaptotagmins; TNF-α: Tumour necrosis factor alpha; IL: Interleukin.
- Citation: Xu H, Zhang LB, Luo YY, Wang L, Zhang YP, Chen PQ, Ba XY, Han J, Luo H. Synaptotagmins family affect glucose transport in retinal pigment epithelial cells through their ubiquitination-mediated degradation and glucose transporter-1 regulation. World J Diabetes 2024; 15(5): 958-976
- URL: https://www.wjgnet.com/1948-9358/full/v15/i5/958.htm
- DOI: https://dx.doi.org/10.4239/wjd.v15.i5.958


