Copyright
©The Author(s) 2024.
World J Diabetes. May 15, 2024; 15(5): 945-957
Published online May 15, 2024. doi: 10.4239/wjd.v15.i5.945
Published online May 15, 2024. doi: 10.4239/wjd.v15.i5.945
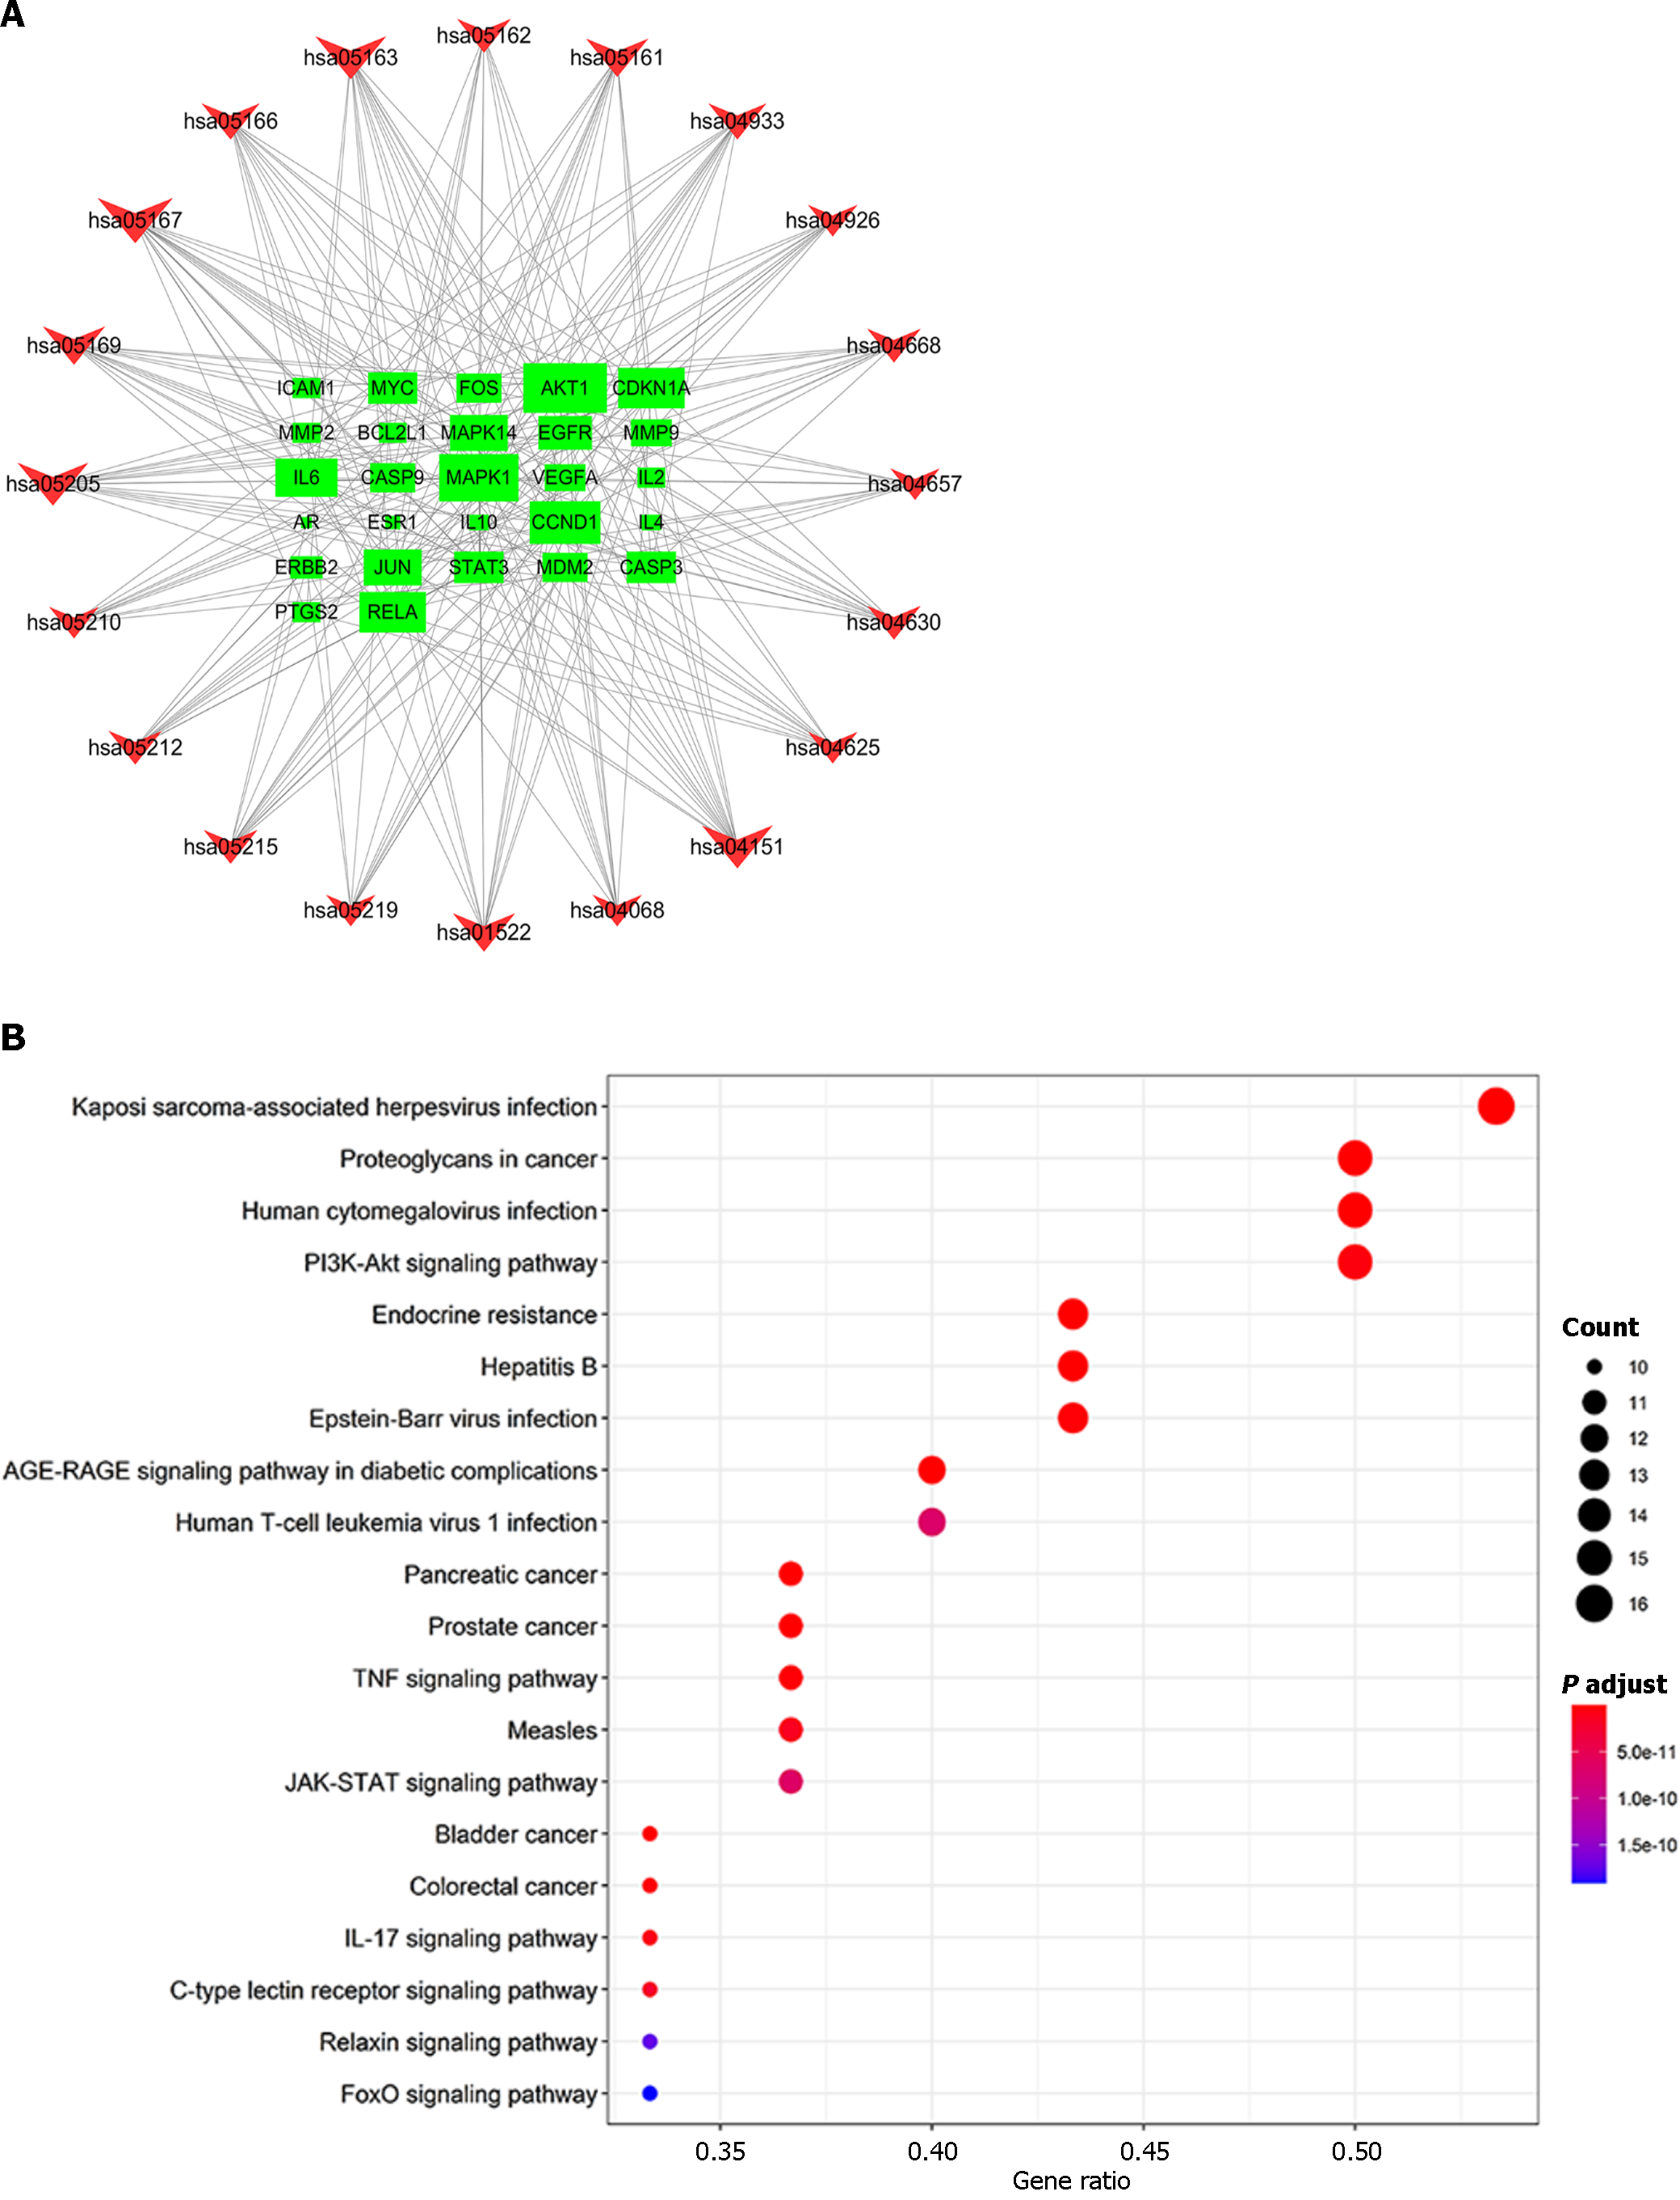
Figure 7 Kyoto Encyclopedia of Genes and Genomes pathway analysis of the top targets.
A: In the Kyoto Encyclopedia of Genes and Genomes (KEGG) network, the green rectangles represent the top targets, and the sizes of the green rectangles represent the target proportions; B: The red inverted triangles represent the top 20 pathways revealed by KEGG pathway analysis; the abscissa represents the gene ratio, and the ordinate scales represent the specific pathways.
- Citation: Kang T, Qin X, Chen Y, Yang Q. Systematic investigation of Radix Salviae for treating diabetic peripheral neuropathy disease based on network Pharmacology. World J Diabetes 2024; 15(5): 945-957
- URL: https://www.wjgnet.com/1948-9358/full/v15/i5/945.htm
- DOI: https://dx.doi.org/10.4239/wjd.v15.i5.945


