Copyright
©The Author(s) 2024.
World J Diabetes. May 15, 2024; 15(5): 898-913
Published online May 15, 2024. doi: 10.4239/wjd.v15.i5.898
Published online May 15, 2024. doi: 10.4239/wjd.v15.i5.898
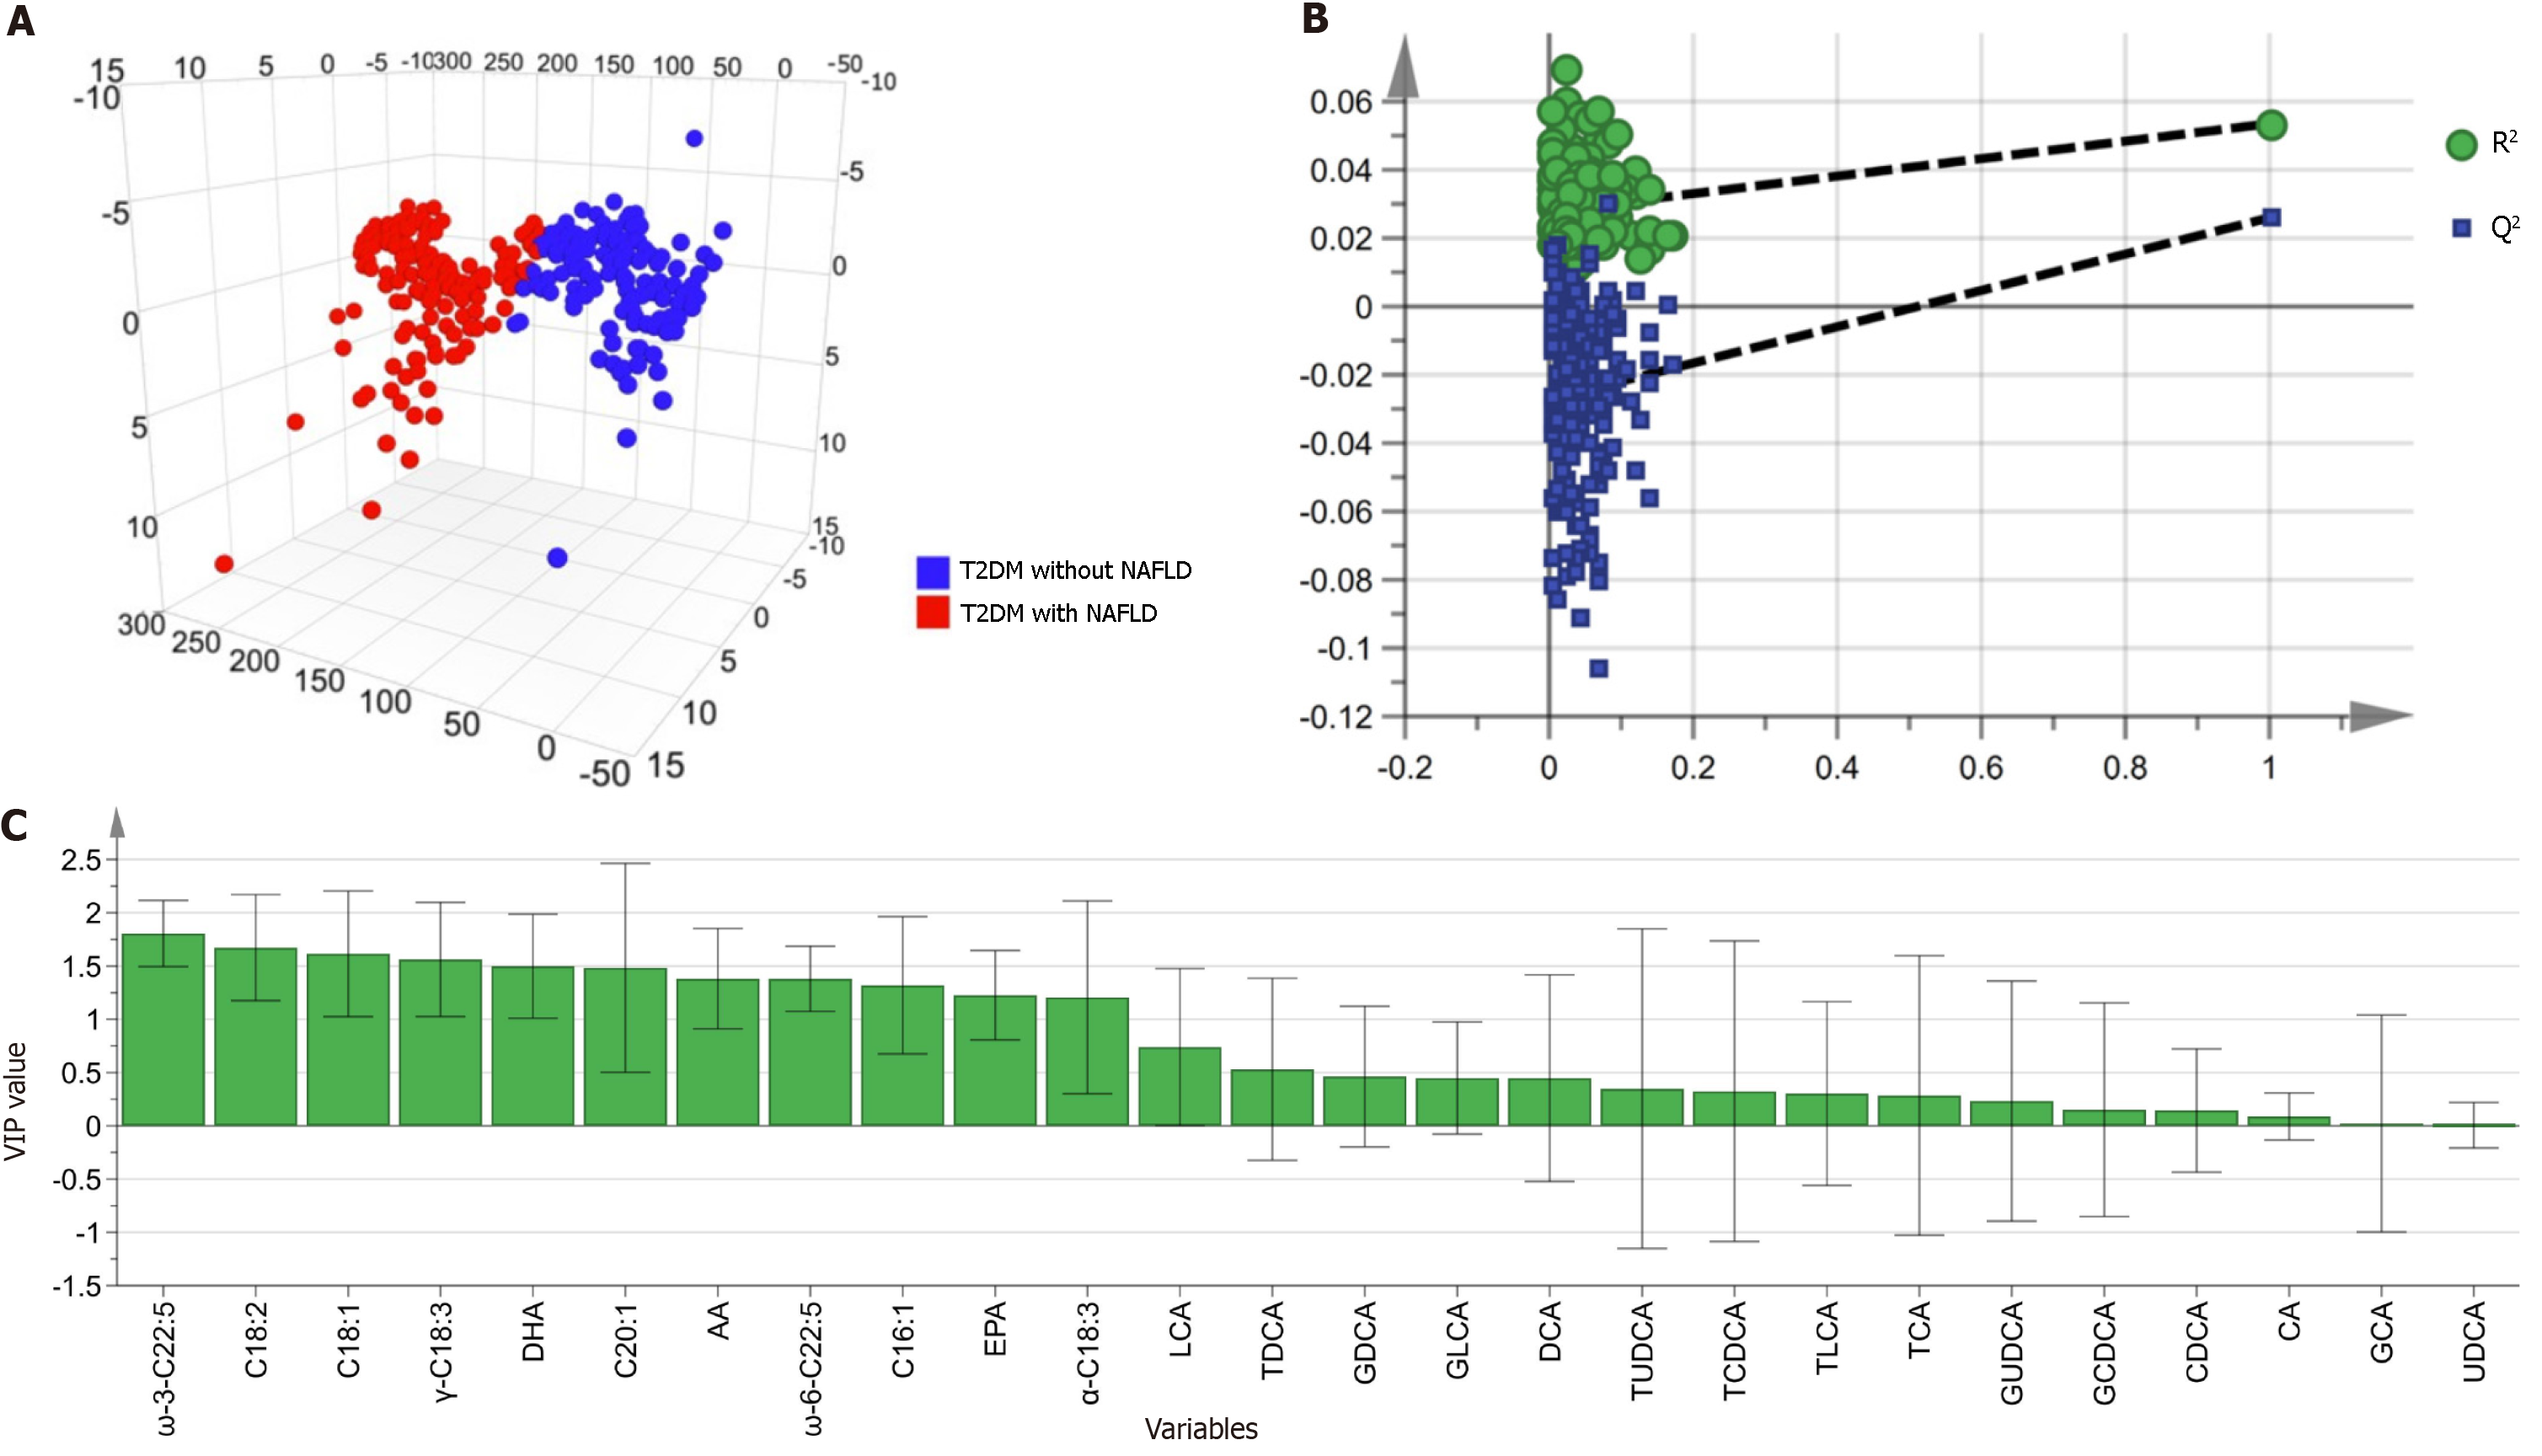
Figure 3 Multivariate analysis of bile acids and unsaturated fatty acids in orthogonal partial least squares-discriminant analysis model.
A: Orthogonal partial least squares-discriminant analysis (OPLS-DA) 3D model between type 2 diabetes (T2DM) with or without non-alcoholic fatty liver disease (NAFLD) groups. R2X = 0.227, R2Y = 0.054, and Q2Y = 0.026; B: The 200−permutation test demonstrated no overfitting in the OPLS-DA model [Q2 = (0, -0.025), R2 = (0, 0.028)]; C: The contribution of the metabolite to distinguish T2DM with or without NAFLD is indicated by variable influence on projection values. NAFLD: Non-alcoholic fatty liver disease; CDCA: Chenodeoxycholic acid; TLCA: Taurolithocholicacid; GDCA: Glycodeoxycholic acid; UDCA: Ursodeoxycholic acid.
- Citation: Feng SS, Wang SJ, Guo L, Ma PP, Ye XL, Pan ML, Hang B, Mao JH, Snijders AM, Lu YB, Ding DF. Serum bile acid and unsaturated fatty acid profiles of non-alcoholic fatty liver disease in type 2 diabetic patients. World J Diabetes 2024; 15(5): 898-913
- URL: https://www.wjgnet.com/1948-9358/full/v15/i5/898.htm
- DOI: https://dx.doi.org/10.4239/wjd.v15.i5.898


