Copyright
©The Author(s) 2024.
World J Diabetes. May 15, 2024; 15(5): 898-913
Published online May 15, 2024. doi: 10.4239/wjd.v15.i5.898
Published online May 15, 2024. doi: 10.4239/wjd.v15.i5.898
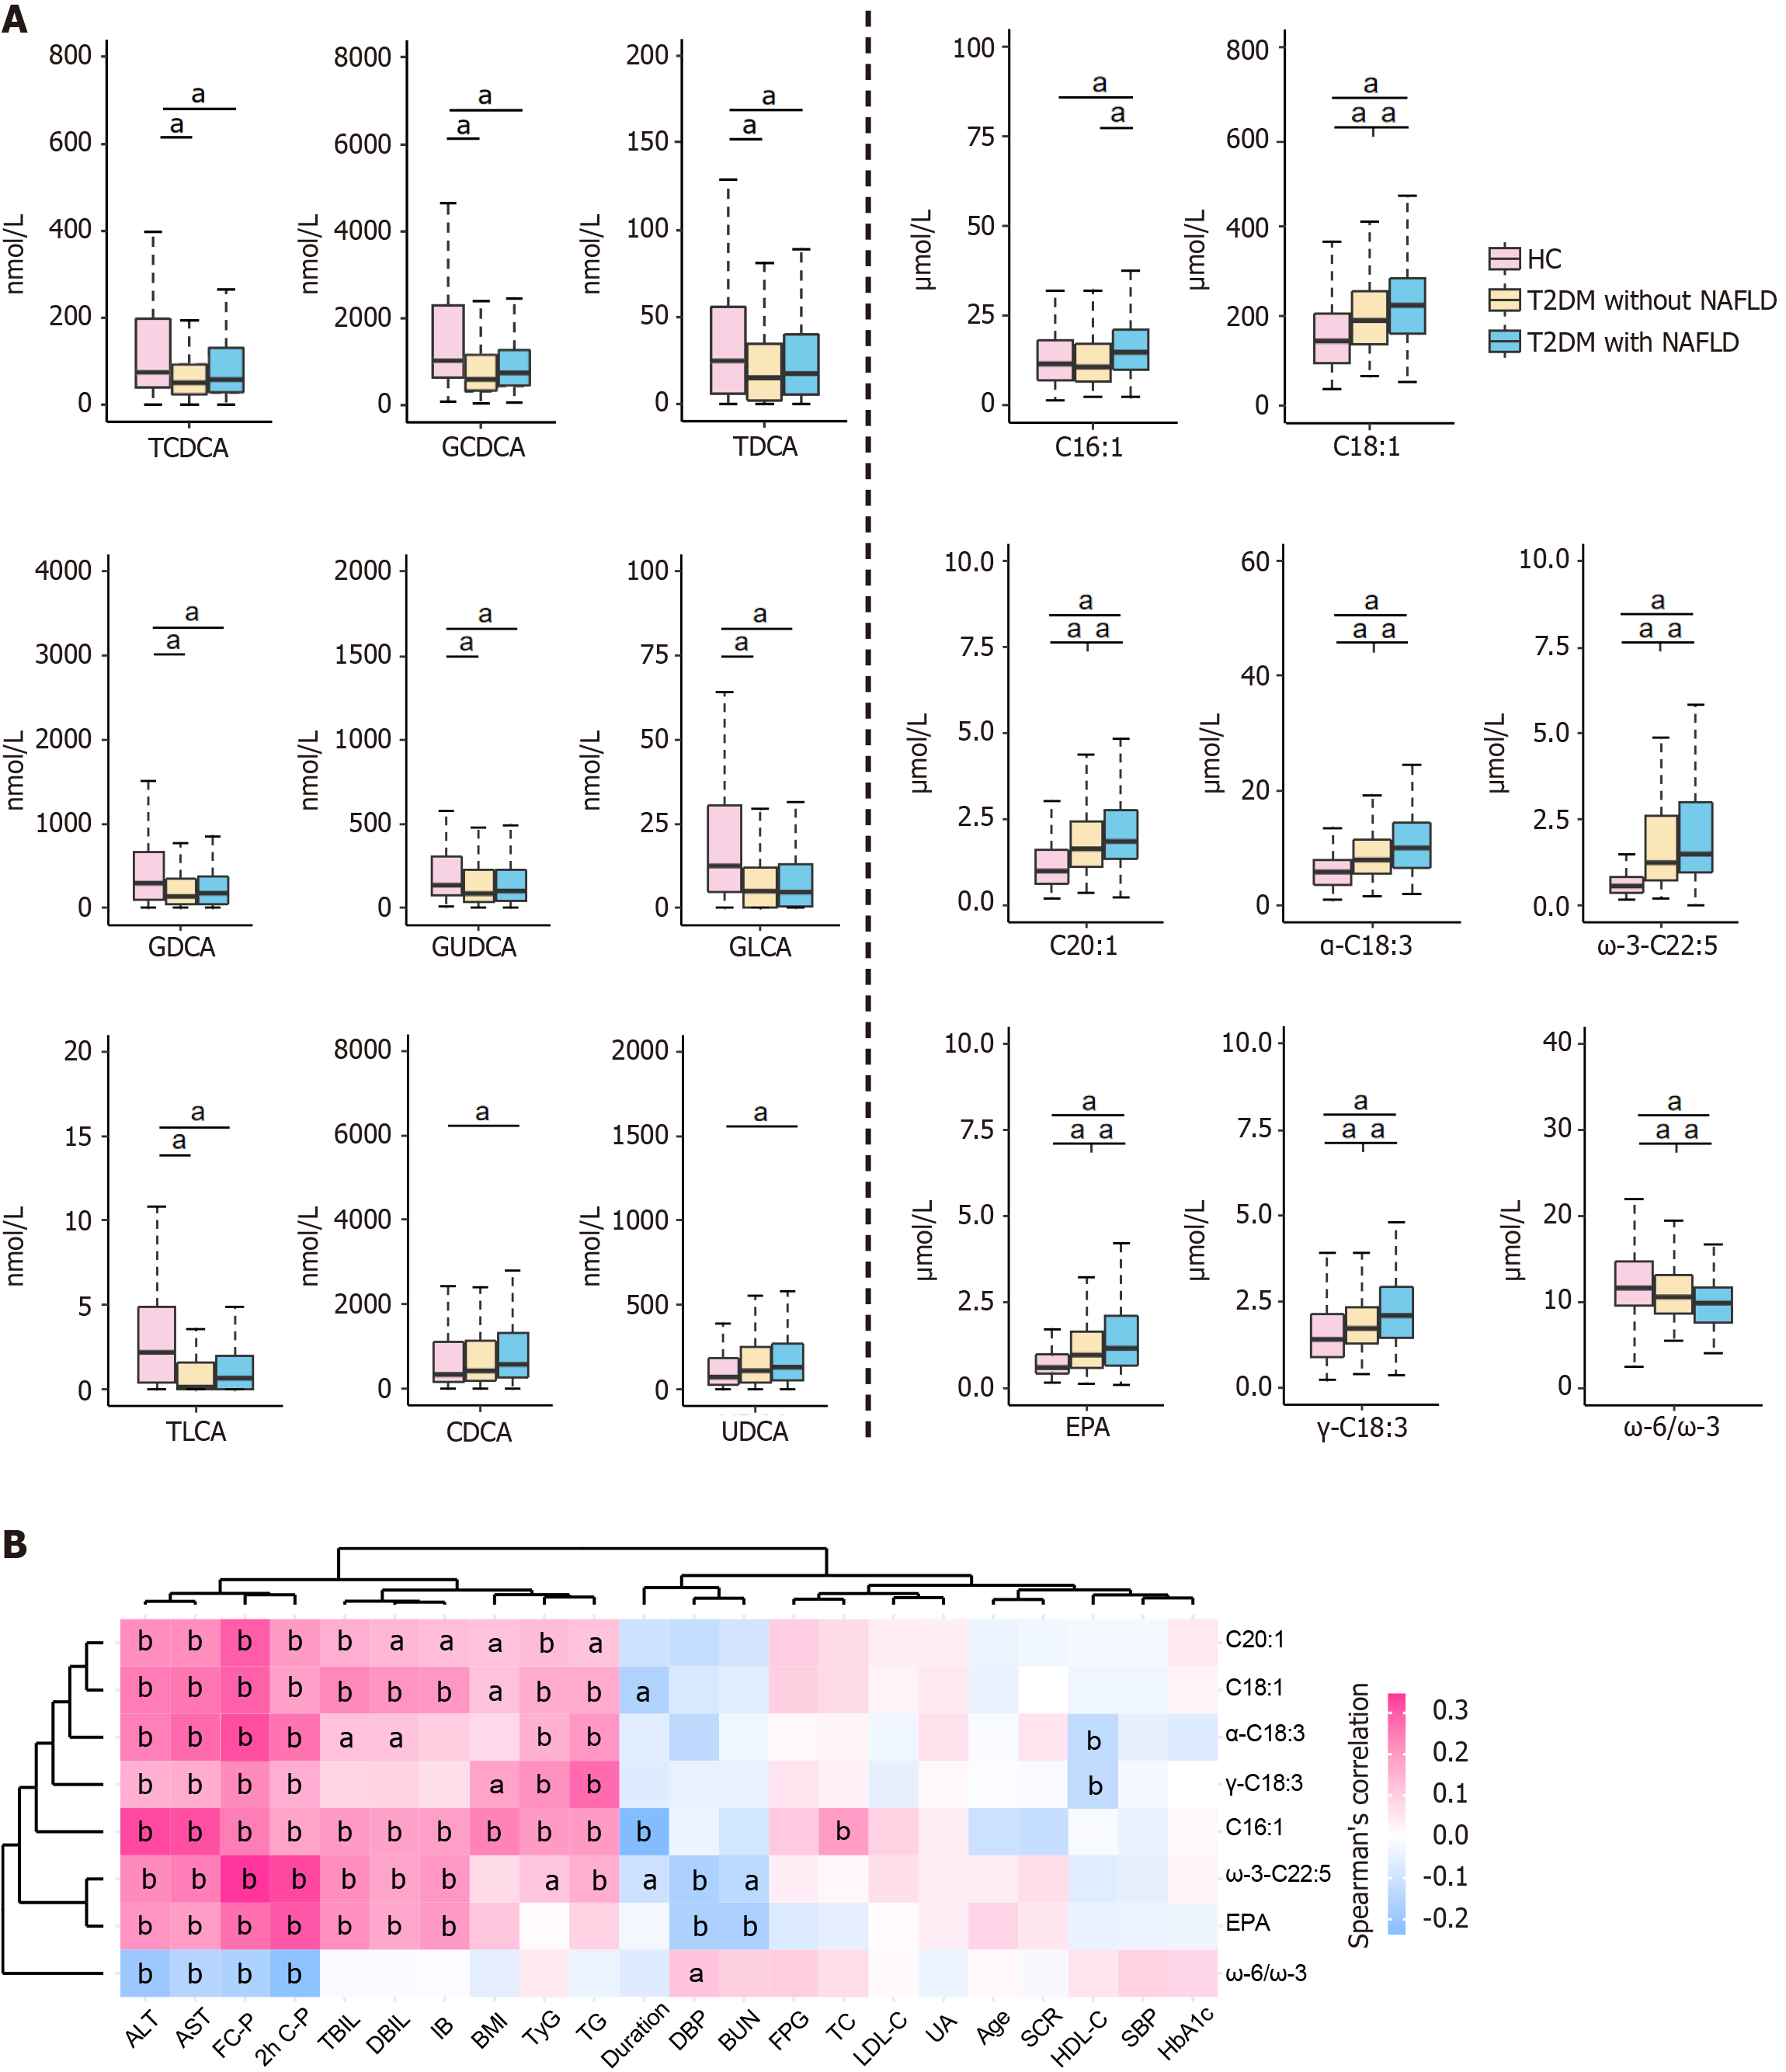
Figure 2 The distribution of bile acids and unsaturated fatty acids distribution among healthy control, type 2 diabetes mellitus without non-alcoholic fatty liver disease, and type 2 diabetes mellitus with non-alcoholic fatty liver disease is examined.
A: Clustering analysis is conducted to analyze the levels of serum bile acids (BAs) and unsaturated fatty acid (UFA). Serum levels of BAs and UFAs in three groups. Wilcoxon test (aP < 0.05); B: Spearman’s correlation analysis between UFAs and clinical indicators in type 2 diabetes mellitus with or without non-alcoholic fatty liver disease (aP < 0.05, bP < 0.01). T2DM: Type 2 diabetes mellitus; HC: Healthy control; NAFLD: Non-alcoholic fatty liver disease; ALT: Alanine aminotransferase; AST: Aspartate aminotransferase; C-P: C-peptide; TBIL: Total bilirubin; DBIL: Direct bilirubin; IB: Indirect bilirubin; BMI: Body mass index; TyG: Triglyceride glucose index; TG: Triglyceride; DBP: Diastolic blood pressure; BUN: Blood urea nitrogen; FPG: Fasting plasma glucose; TC: Total cholesterol; LDL-C: Low-density lipoprotein cholesterol; UA: Uric acid; SCR: Serum creatinine; HDL-C: High-density lipoprotein cholesterol; SBP: Systolic blood pressure; HbA1c: Glycosylated hemoglobin; CDCA: Chenodeoxycholic acid; TLCA: Taurolithocholicacid; GDCA: Glycodeoxycholic acid; UDCA: Ursodeoxycholic acid; TDCA: Taurodeoxycholic acid.
- Citation: Feng SS, Wang SJ, Guo L, Ma PP, Ye XL, Pan ML, Hang B, Mao JH, Snijders AM, Lu YB, Ding DF. Serum bile acid and unsaturated fatty acid profiles of non-alcoholic fatty liver disease in type 2 diabetic patients. World J Diabetes 2024; 15(5): 898-913
- URL: https://www.wjgnet.com/1948-9358/full/v15/i5/898.htm
- DOI: https://dx.doi.org/10.4239/wjd.v15.i5.898


