Copyright
©The Author(s) 2024.
World J Diabetes. Apr 15, 2024; 15(4): 735-757
Published online Apr 15, 2024. doi: 10.4239/wjd.v15.i4.735
Published online Apr 15, 2024. doi: 10.4239/wjd.v15.i4.735
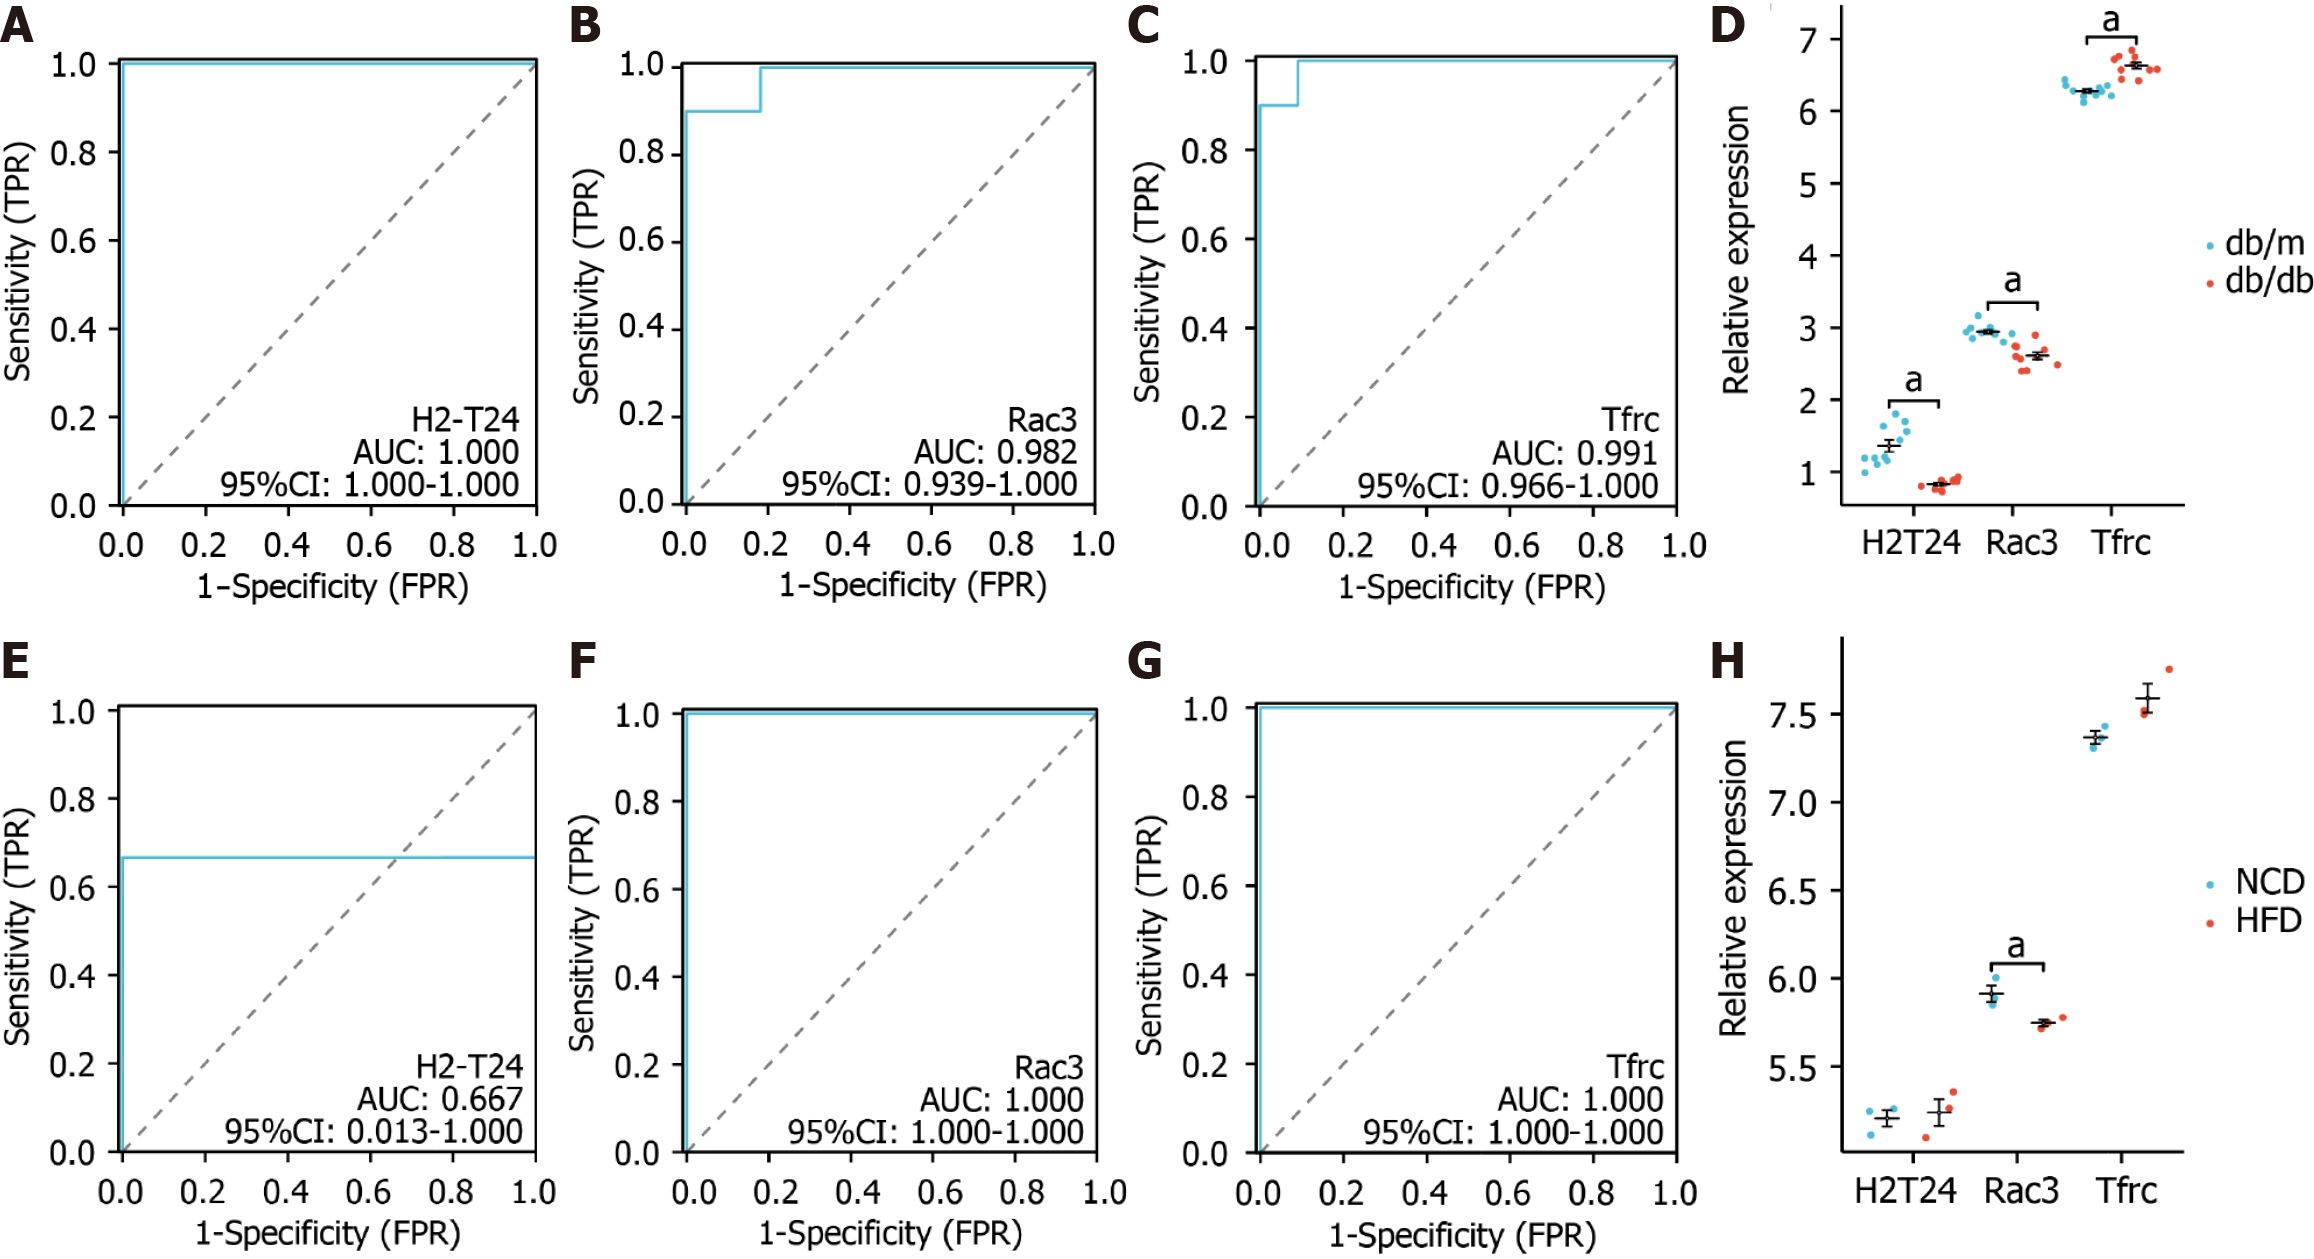
Figure 7 Evaluation of the receiver operating characteristic.
A-C: In GSE125387, the receiver operating characteristic (ROC) curve for each candidate gene (H2-T24, Rac3, and Tfrc) was analyzed; D: The levels of expression for the three genes in GSE125387; E-G: In GSE152539, the ROC curve for each candidate gene (H2-T24, Rac3, and Tfrc) is displayed; H: The levels of expression for the three genes in GSE152539 were also confirmed. aP < 0.05. AUC: Area under the curve; 95%CI: 95% confidence interval; TPR: True-positive rate; FPR: False-positive rate.
- Citation: Gao J, Zou Y, Lv XY, Chen L, Hou XG. Novel insights into immune-related genes associated with type 2 diabetes mellitus-related cognitive impairment. World J Diabetes 2024; 15(4): 735-757
- URL: https://www.wjgnet.com/1948-9358/full/v15/i4/735.htm
- DOI: https://dx.doi.org/10.4239/wjd.v15.i4.735


