Copyright
©The Author(s) 2024.
World J Diabetes. Apr 15, 2024; 15(4): 735-757
Published online Apr 15, 2024. doi: 10.4239/wjd.v15.i4.735
Published online Apr 15, 2024. doi: 10.4239/wjd.v15.i4.735
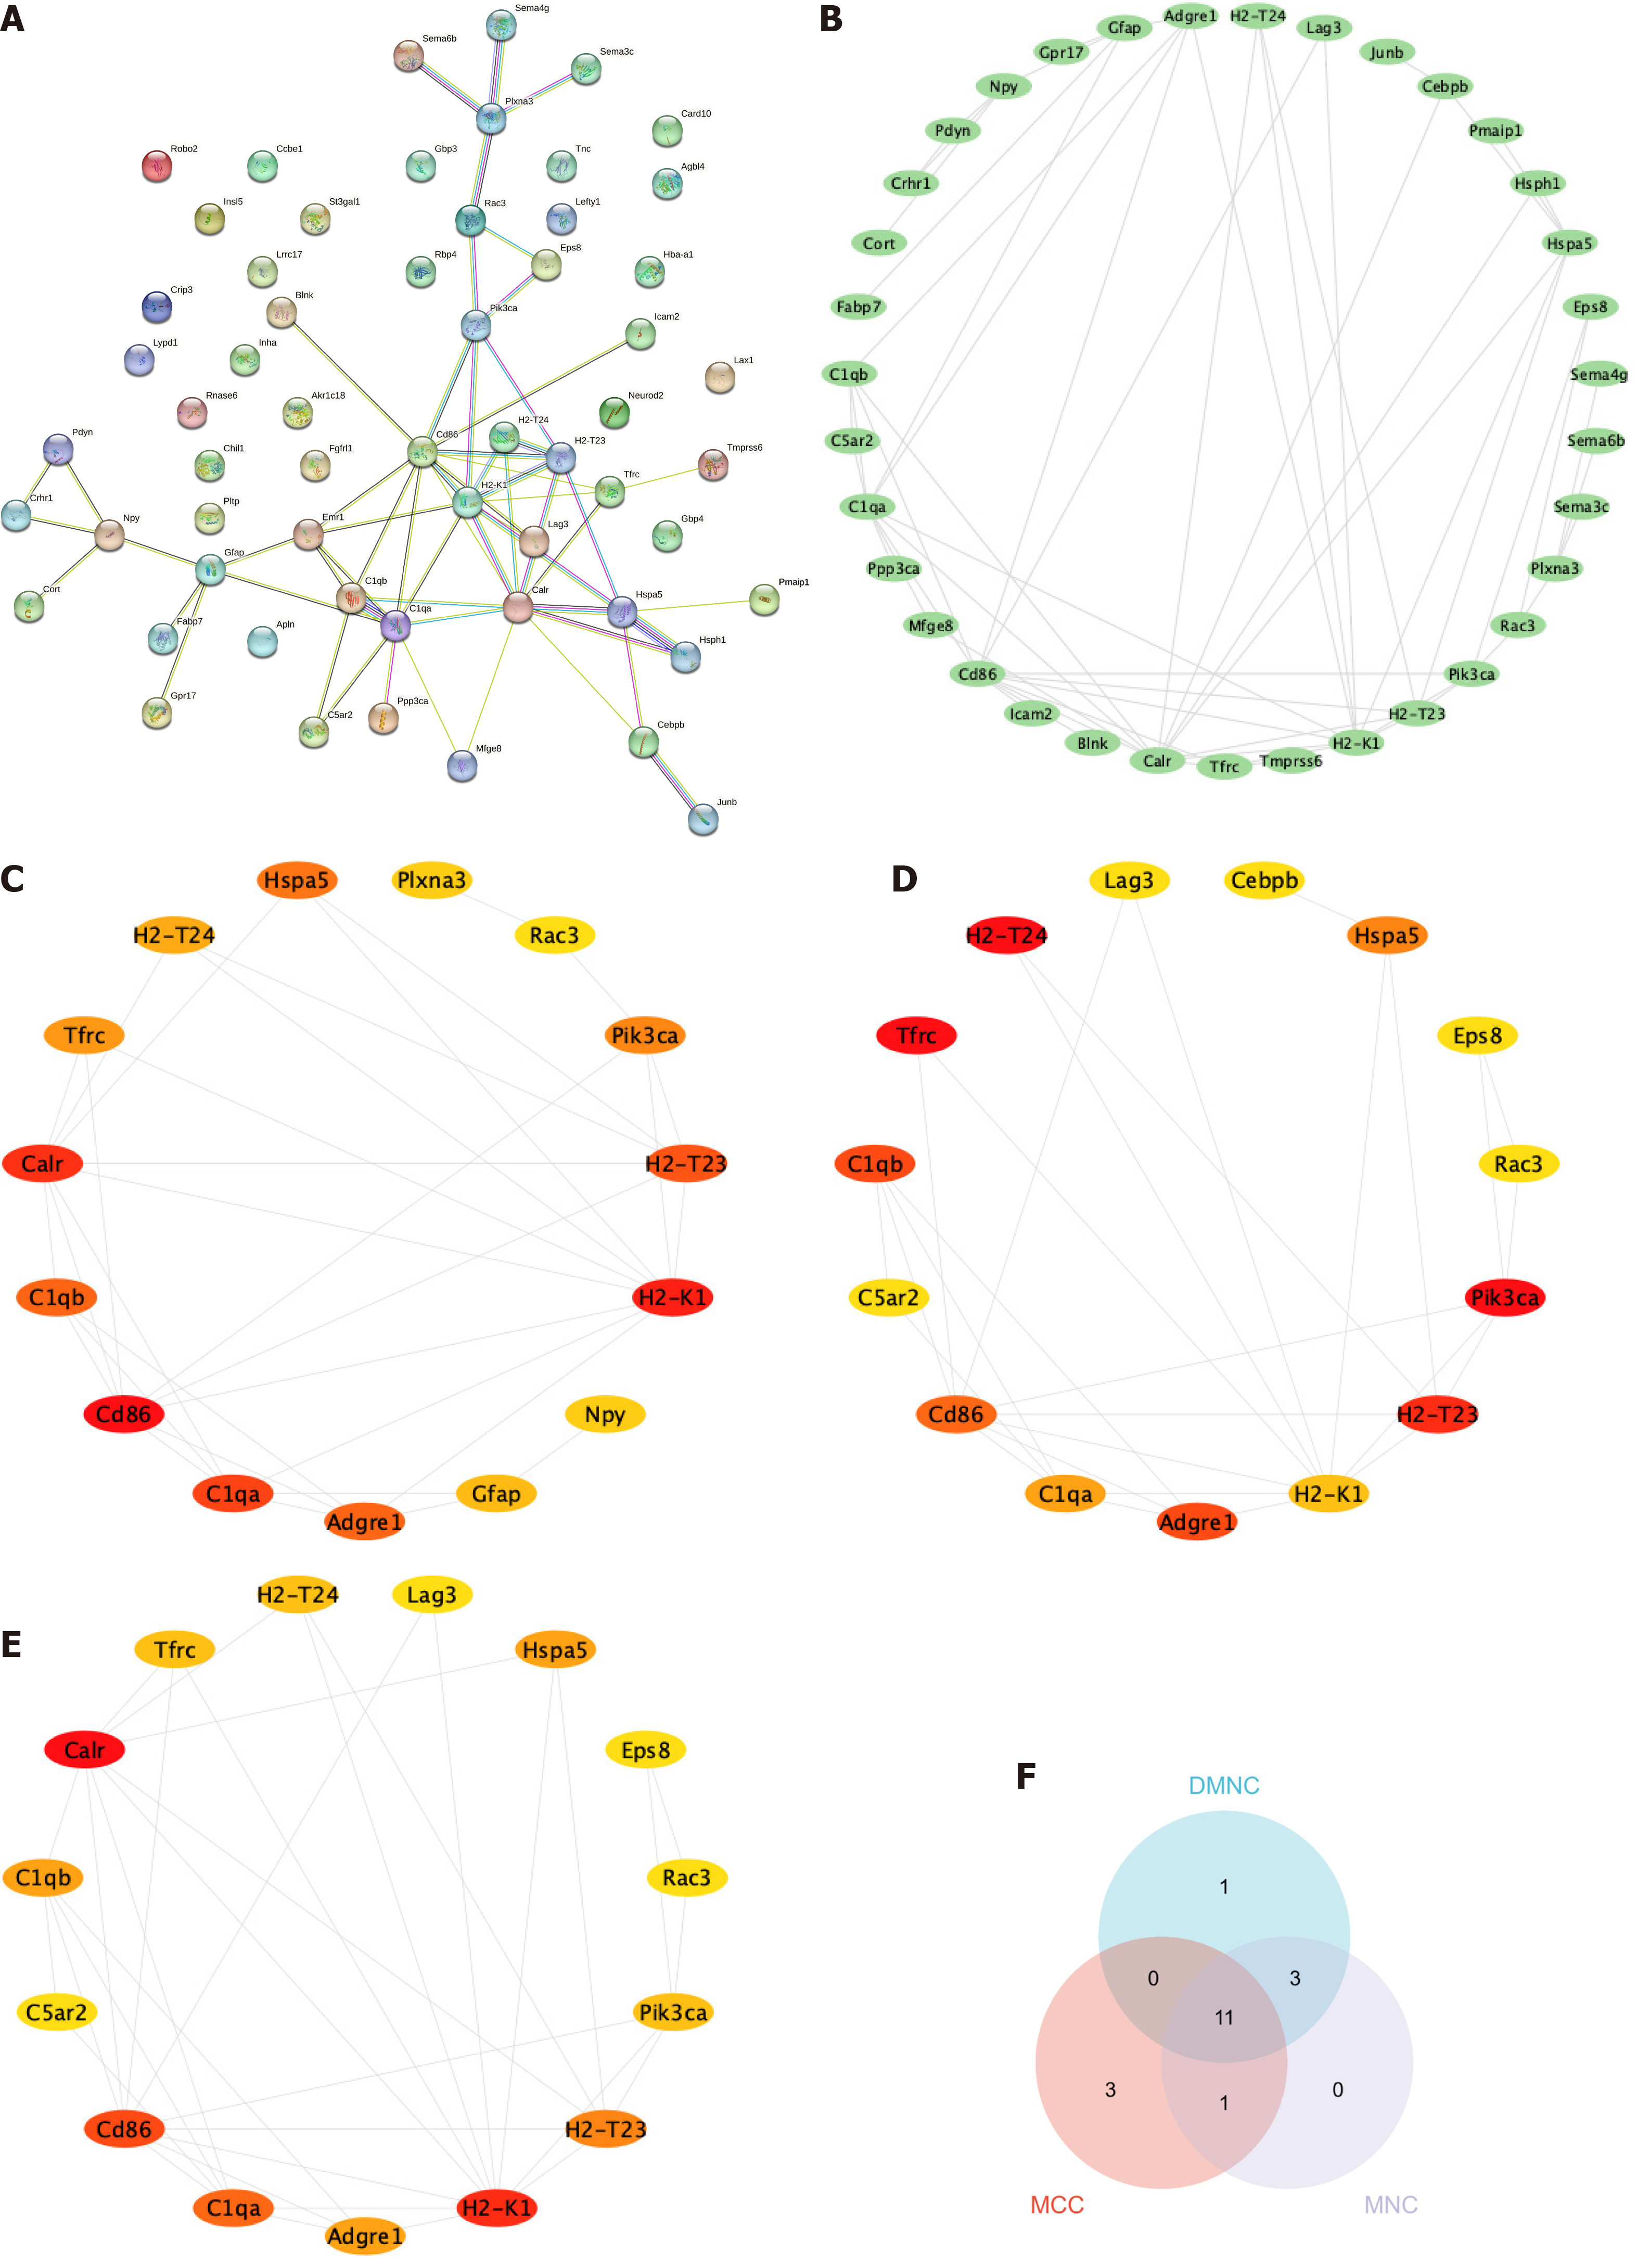
Figure 5 Construction of a network for the interaction between proteins.
A and B: The protein-protein interaction network analysis shows that 35 genes have interactions with one another; C-E: Top 15 genes were independently ranked by Maximal Clique Centrality, Density of Maximum Neighborhood Component and Maximum Neighborhood Component methods. The scores were ordered by color from red to yellow; F: The overlap of the top 15 genes obtained from the three methods resulted in a total of 11 genes. MCC: Maximal Clique Centrality; DMNC: Density of Maximum Neighborhood Component; MNC: Maximum Neighborhood Component.
- Citation: Gao J, Zou Y, Lv XY, Chen L, Hou XG. Novel insights into immune-related genes associated with type 2 diabetes mellitus-related cognitive impairment. World J Diabetes 2024; 15(4): 735-757
- URL: https://www.wjgnet.com/1948-9358/full/v15/i4/735.htm
- DOI: https://dx.doi.org/10.4239/wjd.v15.i4.735


