Copyright
©The Author(s) 2024.
World J Diabetes. Apr 15, 2024; 15(4): 735-757
Published online Apr 15, 2024. doi: 10.4239/wjd.v15.i4.735
Published online Apr 15, 2024. doi: 10.4239/wjd.v15.i4.735
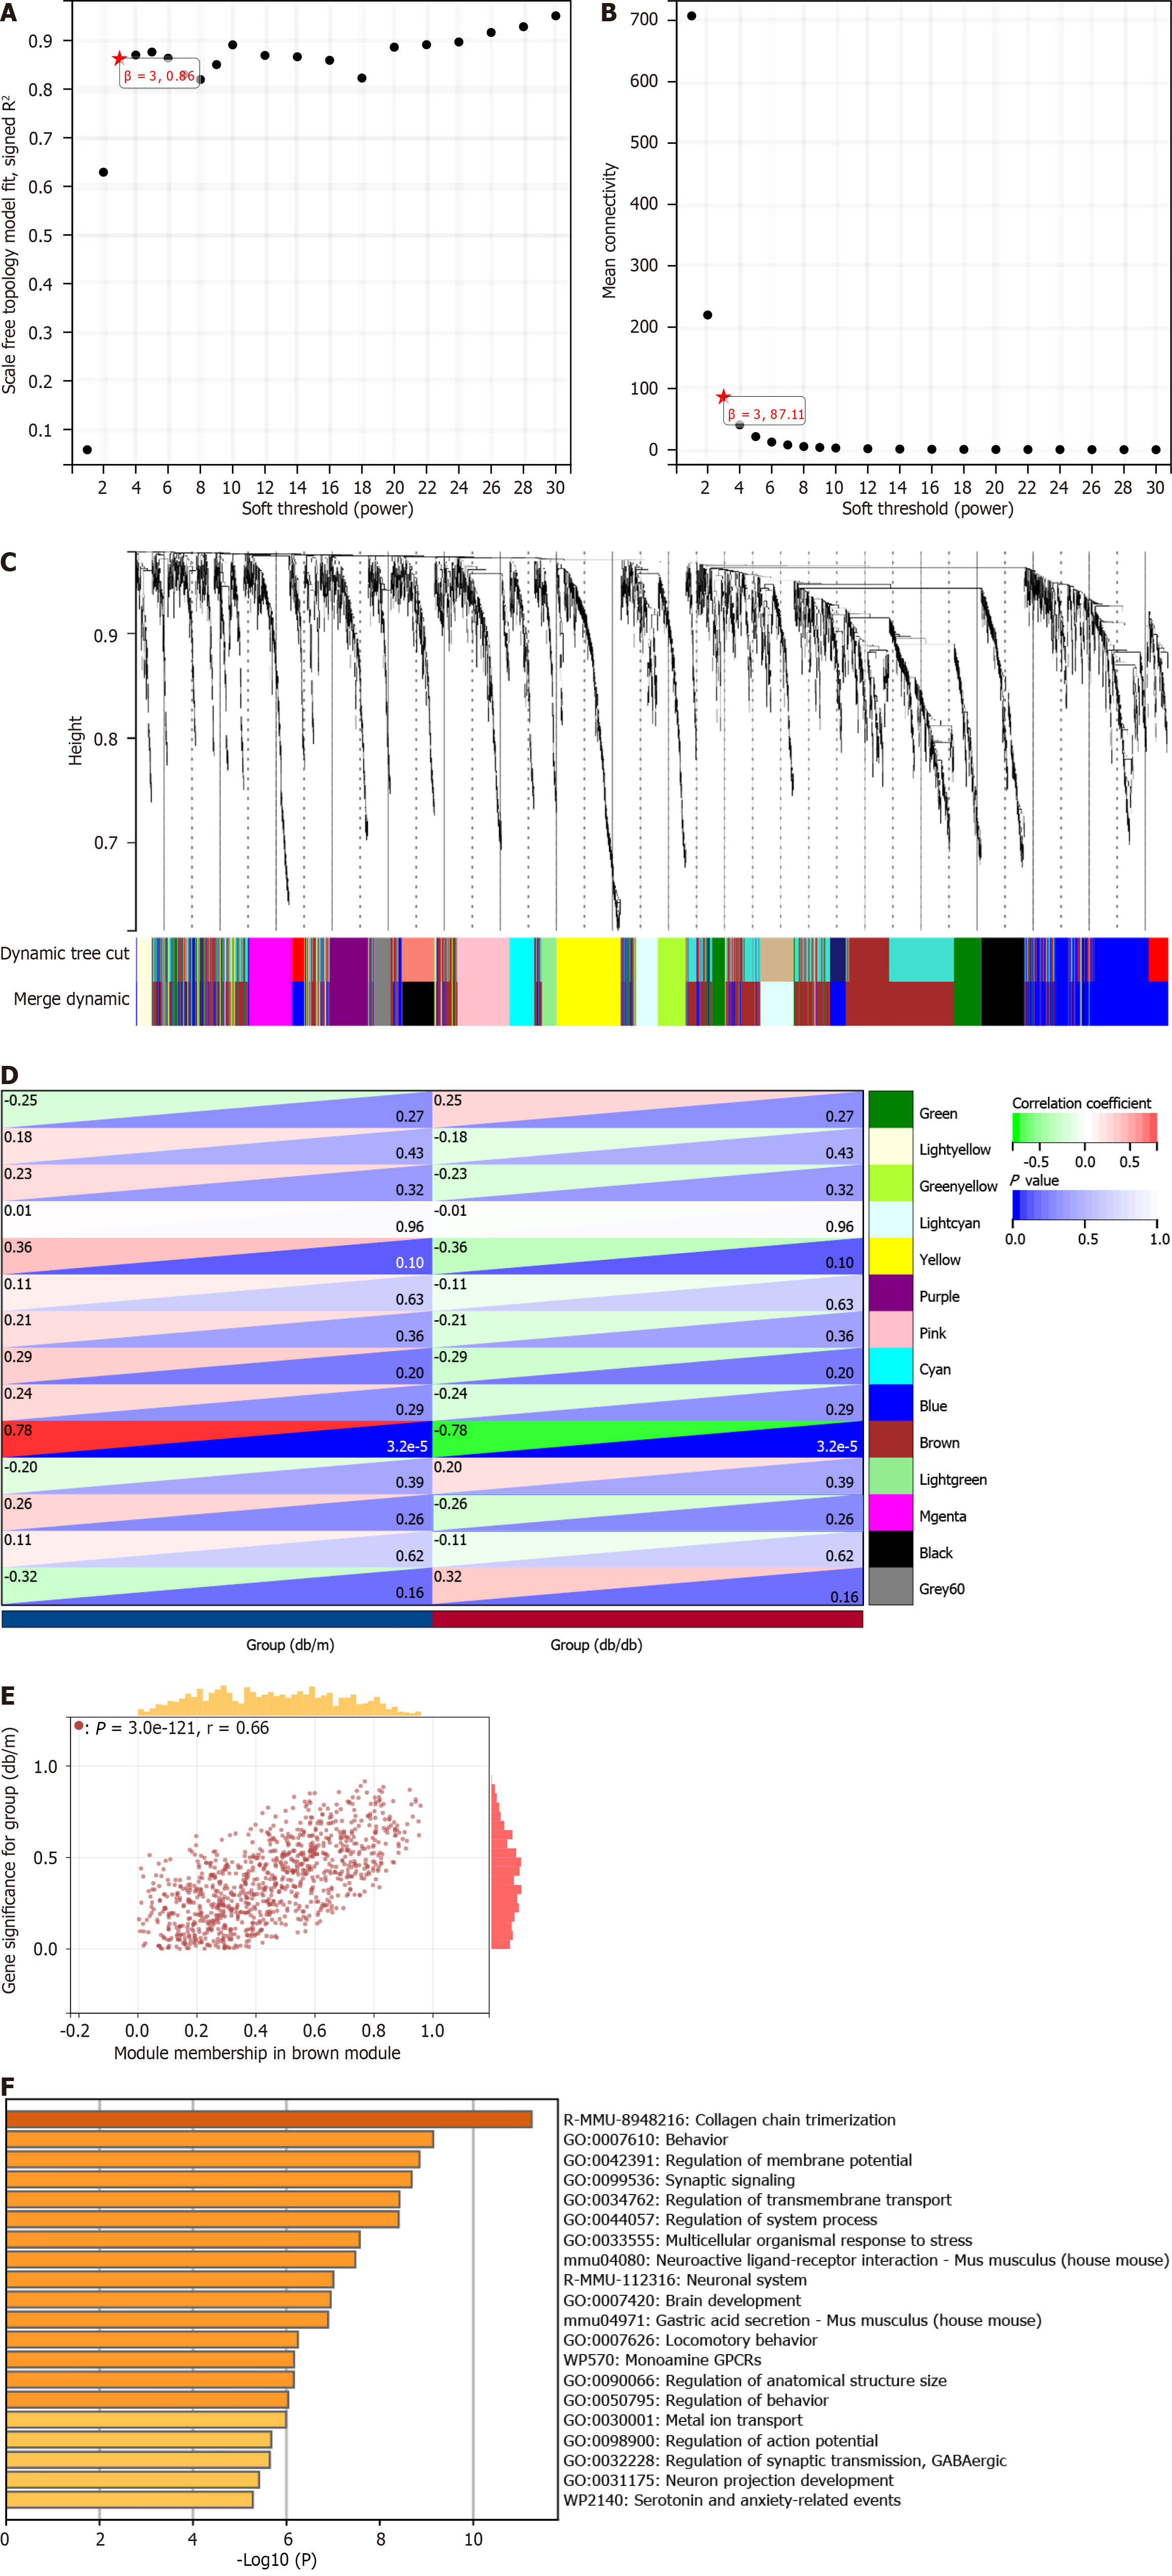
Figure 3 Identification of module genes via Weighted Gene Co-Expression Network Analysis.
A and B: The soft threshold β = 3 is chosen as the result of the combined analysis of scale independence and average connectivity; C: Different colors represent gene co-expression modules in the gene tree; D: Heatmap illustrating the correlation between modules and type 2 diabetes mellitus (T2DM). There is a significant correlation between the brown module and T2DM; E: The brown module contains 974 genes, and the scatter diagram shows the correlation between membership in the brown module and gene significance for the group; F: Analysis of gene enrichment in the brown module for functional purposes.
- Citation: Gao J, Zou Y, Lv XY, Chen L, Hou XG. Novel insights into immune-related genes associated with type 2 diabetes mellitus-related cognitive impairment. World J Diabetes 2024; 15(4): 735-757
- URL: https://www.wjgnet.com/1948-9358/full/v15/i4/735.htm
- DOI: https://dx.doi.org/10.4239/wjd.v15.i4.735


