Copyright
©The Author(s) 2024.
World J Diabetes. Apr 15, 2024; 15(4): 645-653
Published online Apr 15, 2024. doi: 10.4239/wjd.v15.i4.645
Published online Apr 15, 2024. doi: 10.4239/wjd.v15.i4.645
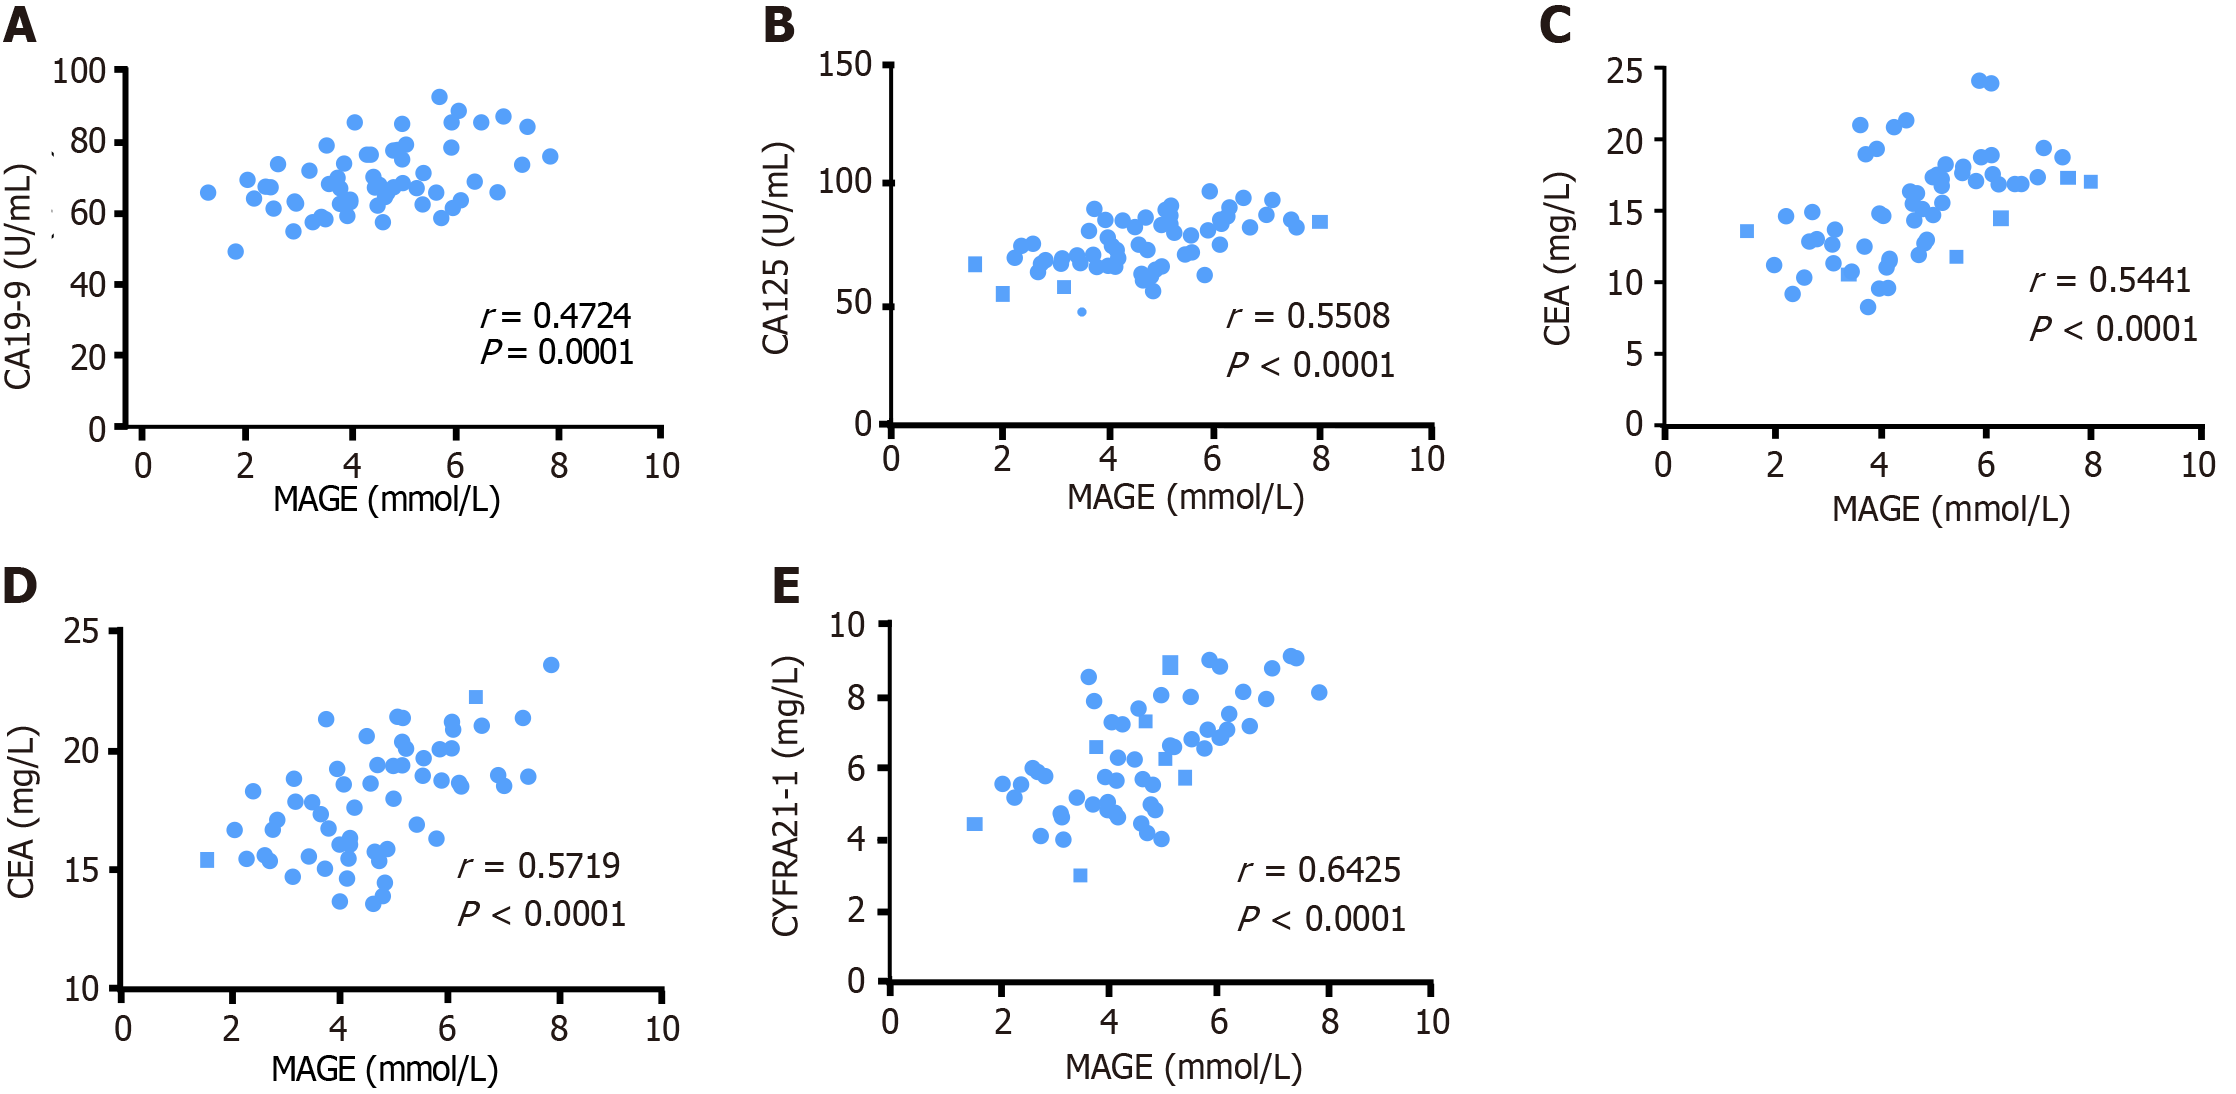
Figure 3 Correlation between mean amplitude of glycemic excursions and tumor markers in all patients.
A: Correlation of mean amplitude of glycemic excursions (MAGE) with carbohydrate antigen 19-9 (CA19-9) level in all patients; B: Correlation of MAGE with CA125 level in all patients; C: Correlation of MAGE with carcinoembryonic antigen level in all patients; D: Correlation of MAGE with neuron-specific enolase level in all patients; E: Correlation of MAGE with cytokeratin 19 level in all patients. MAGE: Mean amplitude of glycemic excursions; CA19-9: Carbohydrate antigen 19-9; CEA: Carcinoembryonic antigen; NSE: Neuron-specific enolase; CYFRA21-1: Cytokeratin 19.
- Citation: Fang TZ, Wu XQ, Zhao TQ, Wang SS, Fu GMZ, Wu QL, Zhou CW. Influence of blood glucose fluctuations on chemotherapy efficacy and safety in type 2 diabetes mellitus patients complicated with lung carcinoma. World J Diabetes 2024; 15(4): 645-653
- URL: https://www.wjgnet.com/1948-9358/full/v15/i4/645.htm
- DOI: https://dx.doi.org/10.4239/wjd.v15.i4.645


