Copyright
©The Author(s) 2024.
World J Diabetes. Mar 15, 2024; 15(3): 519-529
Published online Mar 15, 2024. doi: 10.4239/wjd.v15.i3.519
Published online Mar 15, 2024. doi: 10.4239/wjd.v15.i3.519
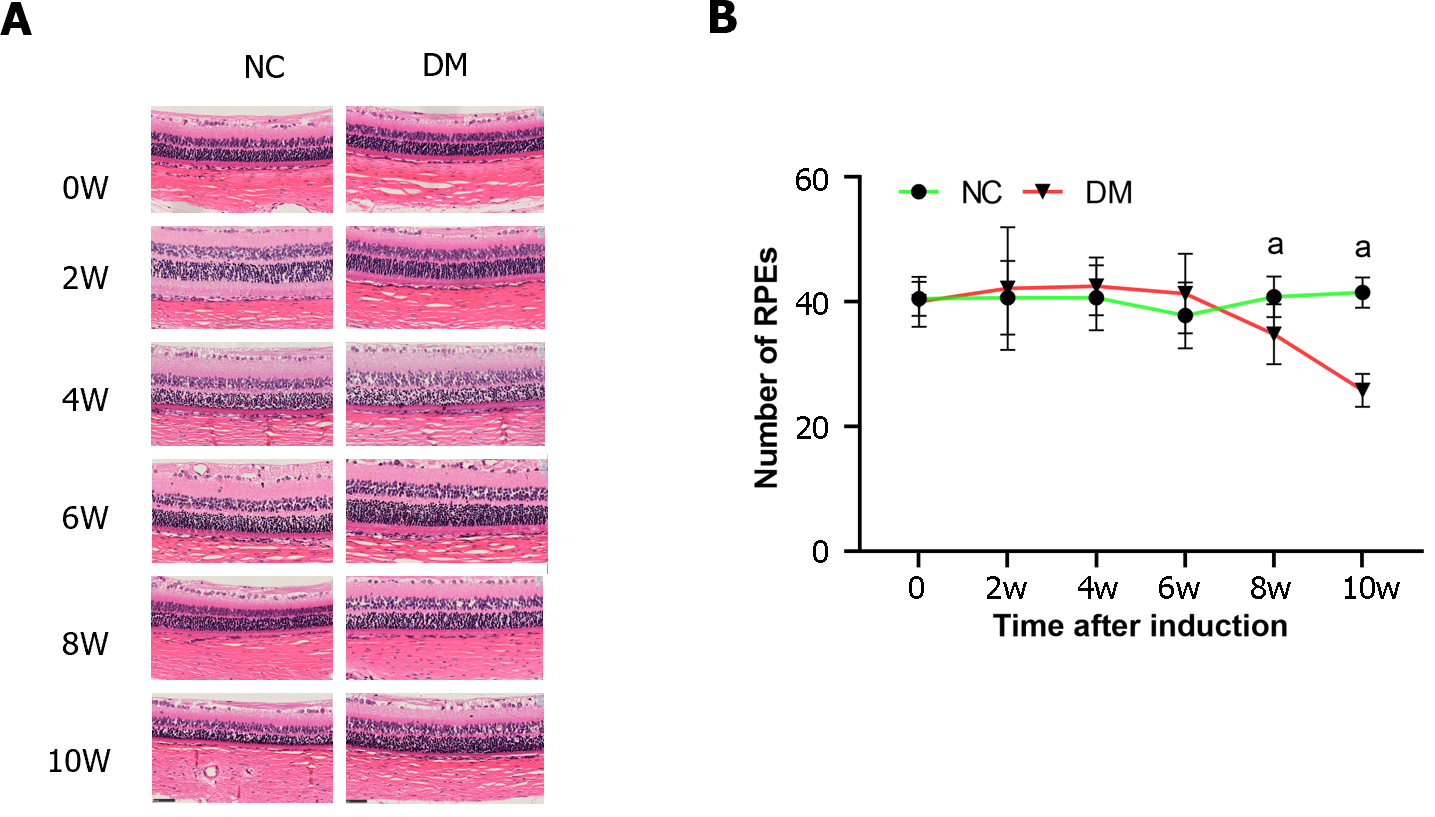
Figure 2 Retinal hematoxylin and eosin staining (magnification, 400) and retinal pigment epithelium cell counts were performed in normal and diabetic rats.
A: The hematoxylin and eosin staining of rat retina; B: The quantification of retinal pigment epithelium cells. The results are expressed as the mean ± SD. aP < 0.05 vs control group. NC: Normal control; DM: Diabetes mellitus.
- Citation: Tan J, Xiao A, Yang L, Tao YL, Shao Y, Zhou Q. Diabetes and high-glucose could upregulate the expression of receptor for activated C kinase 1 in retina. World J Diabetes 2024; 15(3): 519-529
- URL: https://www.wjgnet.com/1948-9358/full/v15/i3/519.htm
- DOI: https://dx.doi.org/10.4239/wjd.v15.i3.519


