Copyright
©The Author(s) 2024.
World J Diabetes. Feb 15, 2024; 15(2): 240-250
Published online Feb 15, 2024. doi: 10.4239/wjd.v15.i2.240
Published online Feb 15, 2024. doi: 10.4239/wjd.v15.i2.240
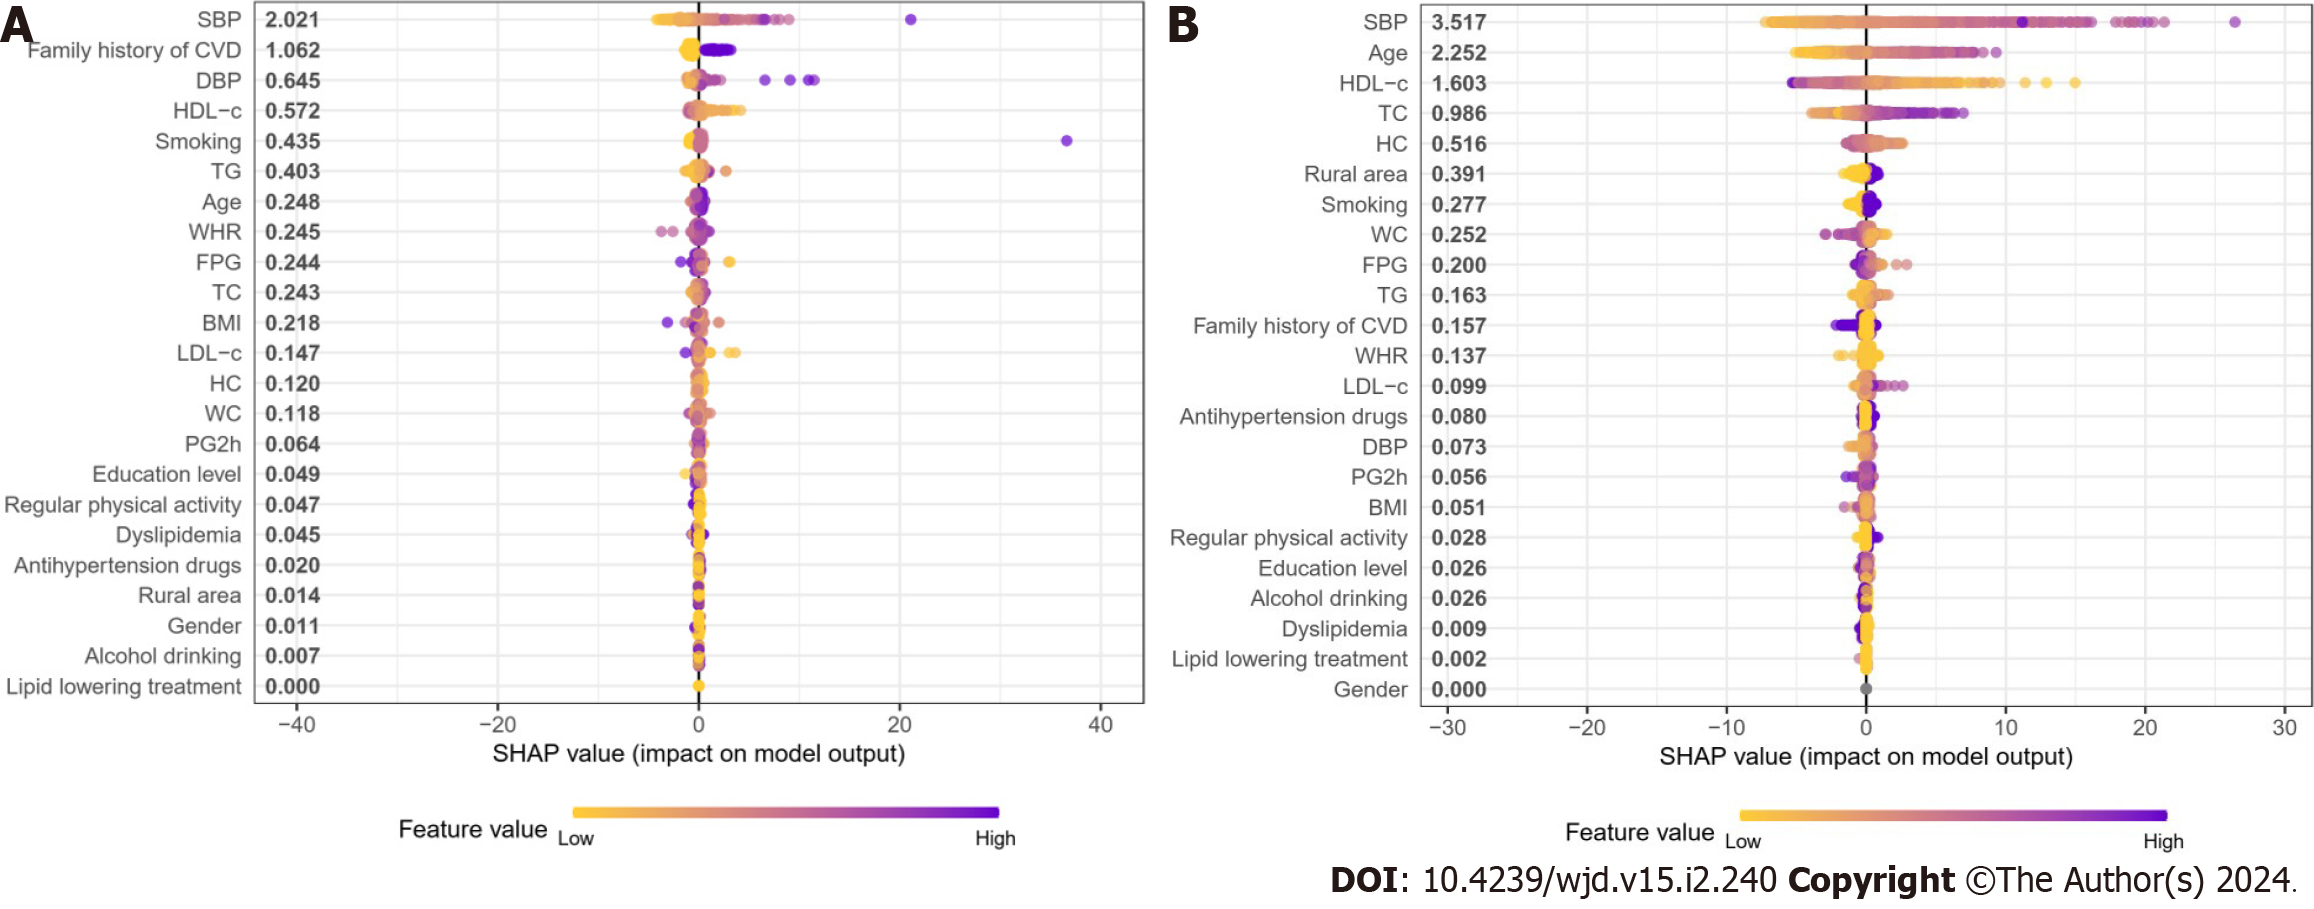
Figure 4 SHapley Additive exPlanation summary plot of the features of the random forest model.
The higher the SHapley Additive exPlanation value of a feature, the higher the probability of the 10-year risk of cardiovascular disease. A dot is created for each feature attribution value for each individual, and thus one individual is allocated one dot on the line for each feature. Dots are colored according to the values of features for the respective individual and accumulate vertically to depict density. Purple represents higher feature values, and yellow represents lower feature values. A: Younger group; B: Older group. CVD: Cardiovascular disease; BMI: Body mass index; WC: Waist circumference; FPG: Fasting plasma glucose; PG2h: 2 h post-load plasma glucose; TC: Total cholesterol; TG: Triglycerides; HDL-c: High-density lipoprotein-cholesterol; LDL-c: Low-density lipoprotein-cholesterol; SBP: Systolic blood pressure; DBP: Diastolic blood pressure; SHAP: SHapley Additive exPlanation.
- Citation: Xie S, Yu LP, Chen F, Wang Y, Deng RF, Zhang XL, Zhang B. Age-specific differences in the association between prediabetes and cardiovascular diseases in China: A national cross-sectional study. World J Diabetes 2024; 15(2): 240-250
- URL: https://www.wjgnet.com/1948-9358/full/v15/i2/240.htm
- DOI: https://dx.doi.org/10.4239/wjd.v15.i2.240


