Copyright
©The Author(s) 2024.
World J Diabetes. Feb 15, 2024; 15(2): 240-250
Published online Feb 15, 2024. doi: 10.4239/wjd.v15.i2.240
Published online Feb 15, 2024. doi: 10.4239/wjd.v15.i2.240
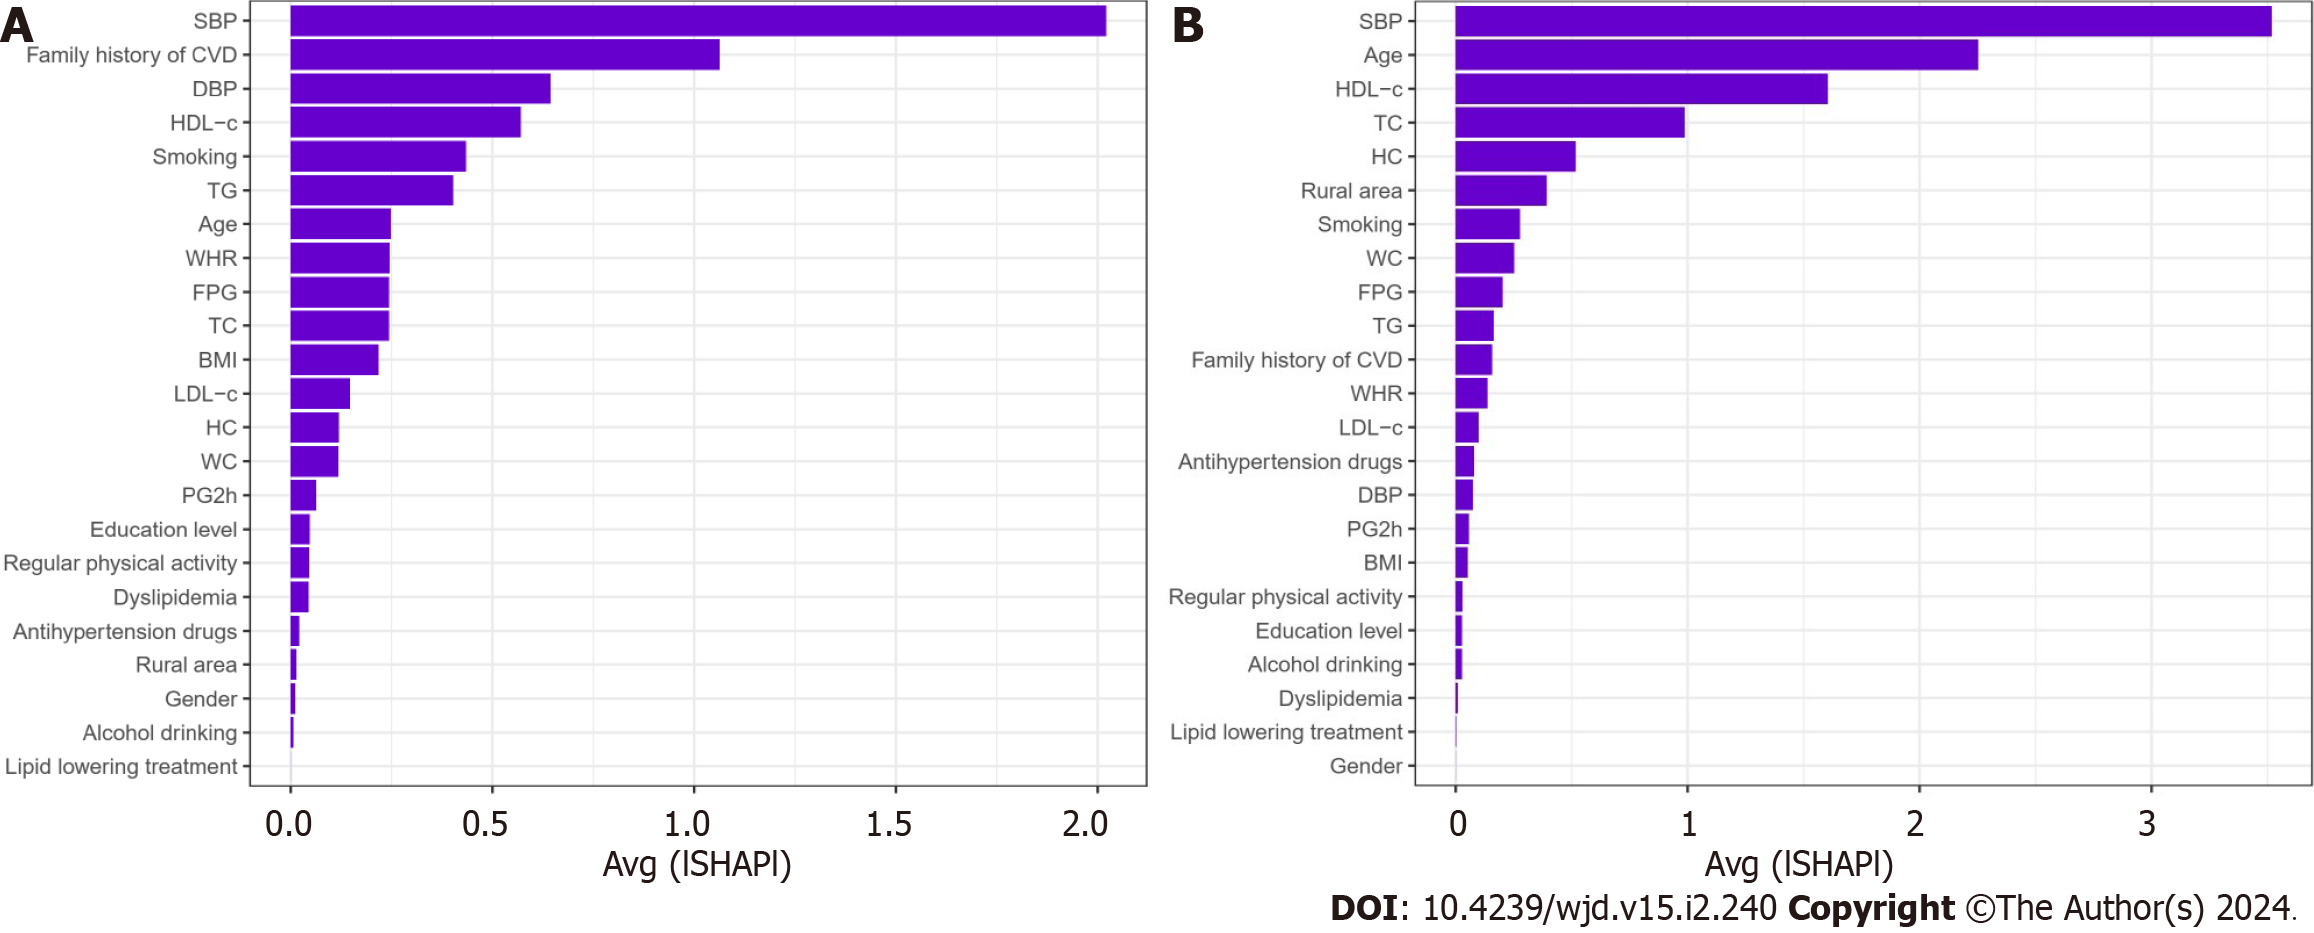
Figure 3 Importance matrix plot of the random forest model.
This importance matrix plot depicts the importance of each covariate in the final predictive model. A: Younger group; B: Older group. CVD: Cardiovascular disease; BMI: Body mass index; WC: Waist circumference; FPG: Fasting plasma glucose; PG2h: 2 h post-load plasma glucose; TC: Total cholesterol; TG: Triglycerides; HDL-c: High-density lipoprotein-cholesterol; LDL-c: Low-density lipoprotein-cholesterol; SBP: Systolic blood pressure; DBP: Diastolic blood pressure; SHAP: SHapley Additive exPlanation.
- Citation: Xie S, Yu LP, Chen F, Wang Y, Deng RF, Zhang XL, Zhang B. Age-specific differences in the association between prediabetes and cardiovascular diseases in China: A national cross-sectional study. World J Diabetes 2024; 15(2): 240-250
- URL: https://www.wjgnet.com/1948-9358/full/v15/i2/240.htm
- DOI: https://dx.doi.org/10.4239/wjd.v15.i2.240


