Copyright
©The Author(s) 2024.
World J Diabetes. Feb 15, 2024; 15(2): 170-185
Published online Feb 15, 2024. doi: 10.4239/wjd.v15.i2.170
Published online Feb 15, 2024. doi: 10.4239/wjd.v15.i2.170
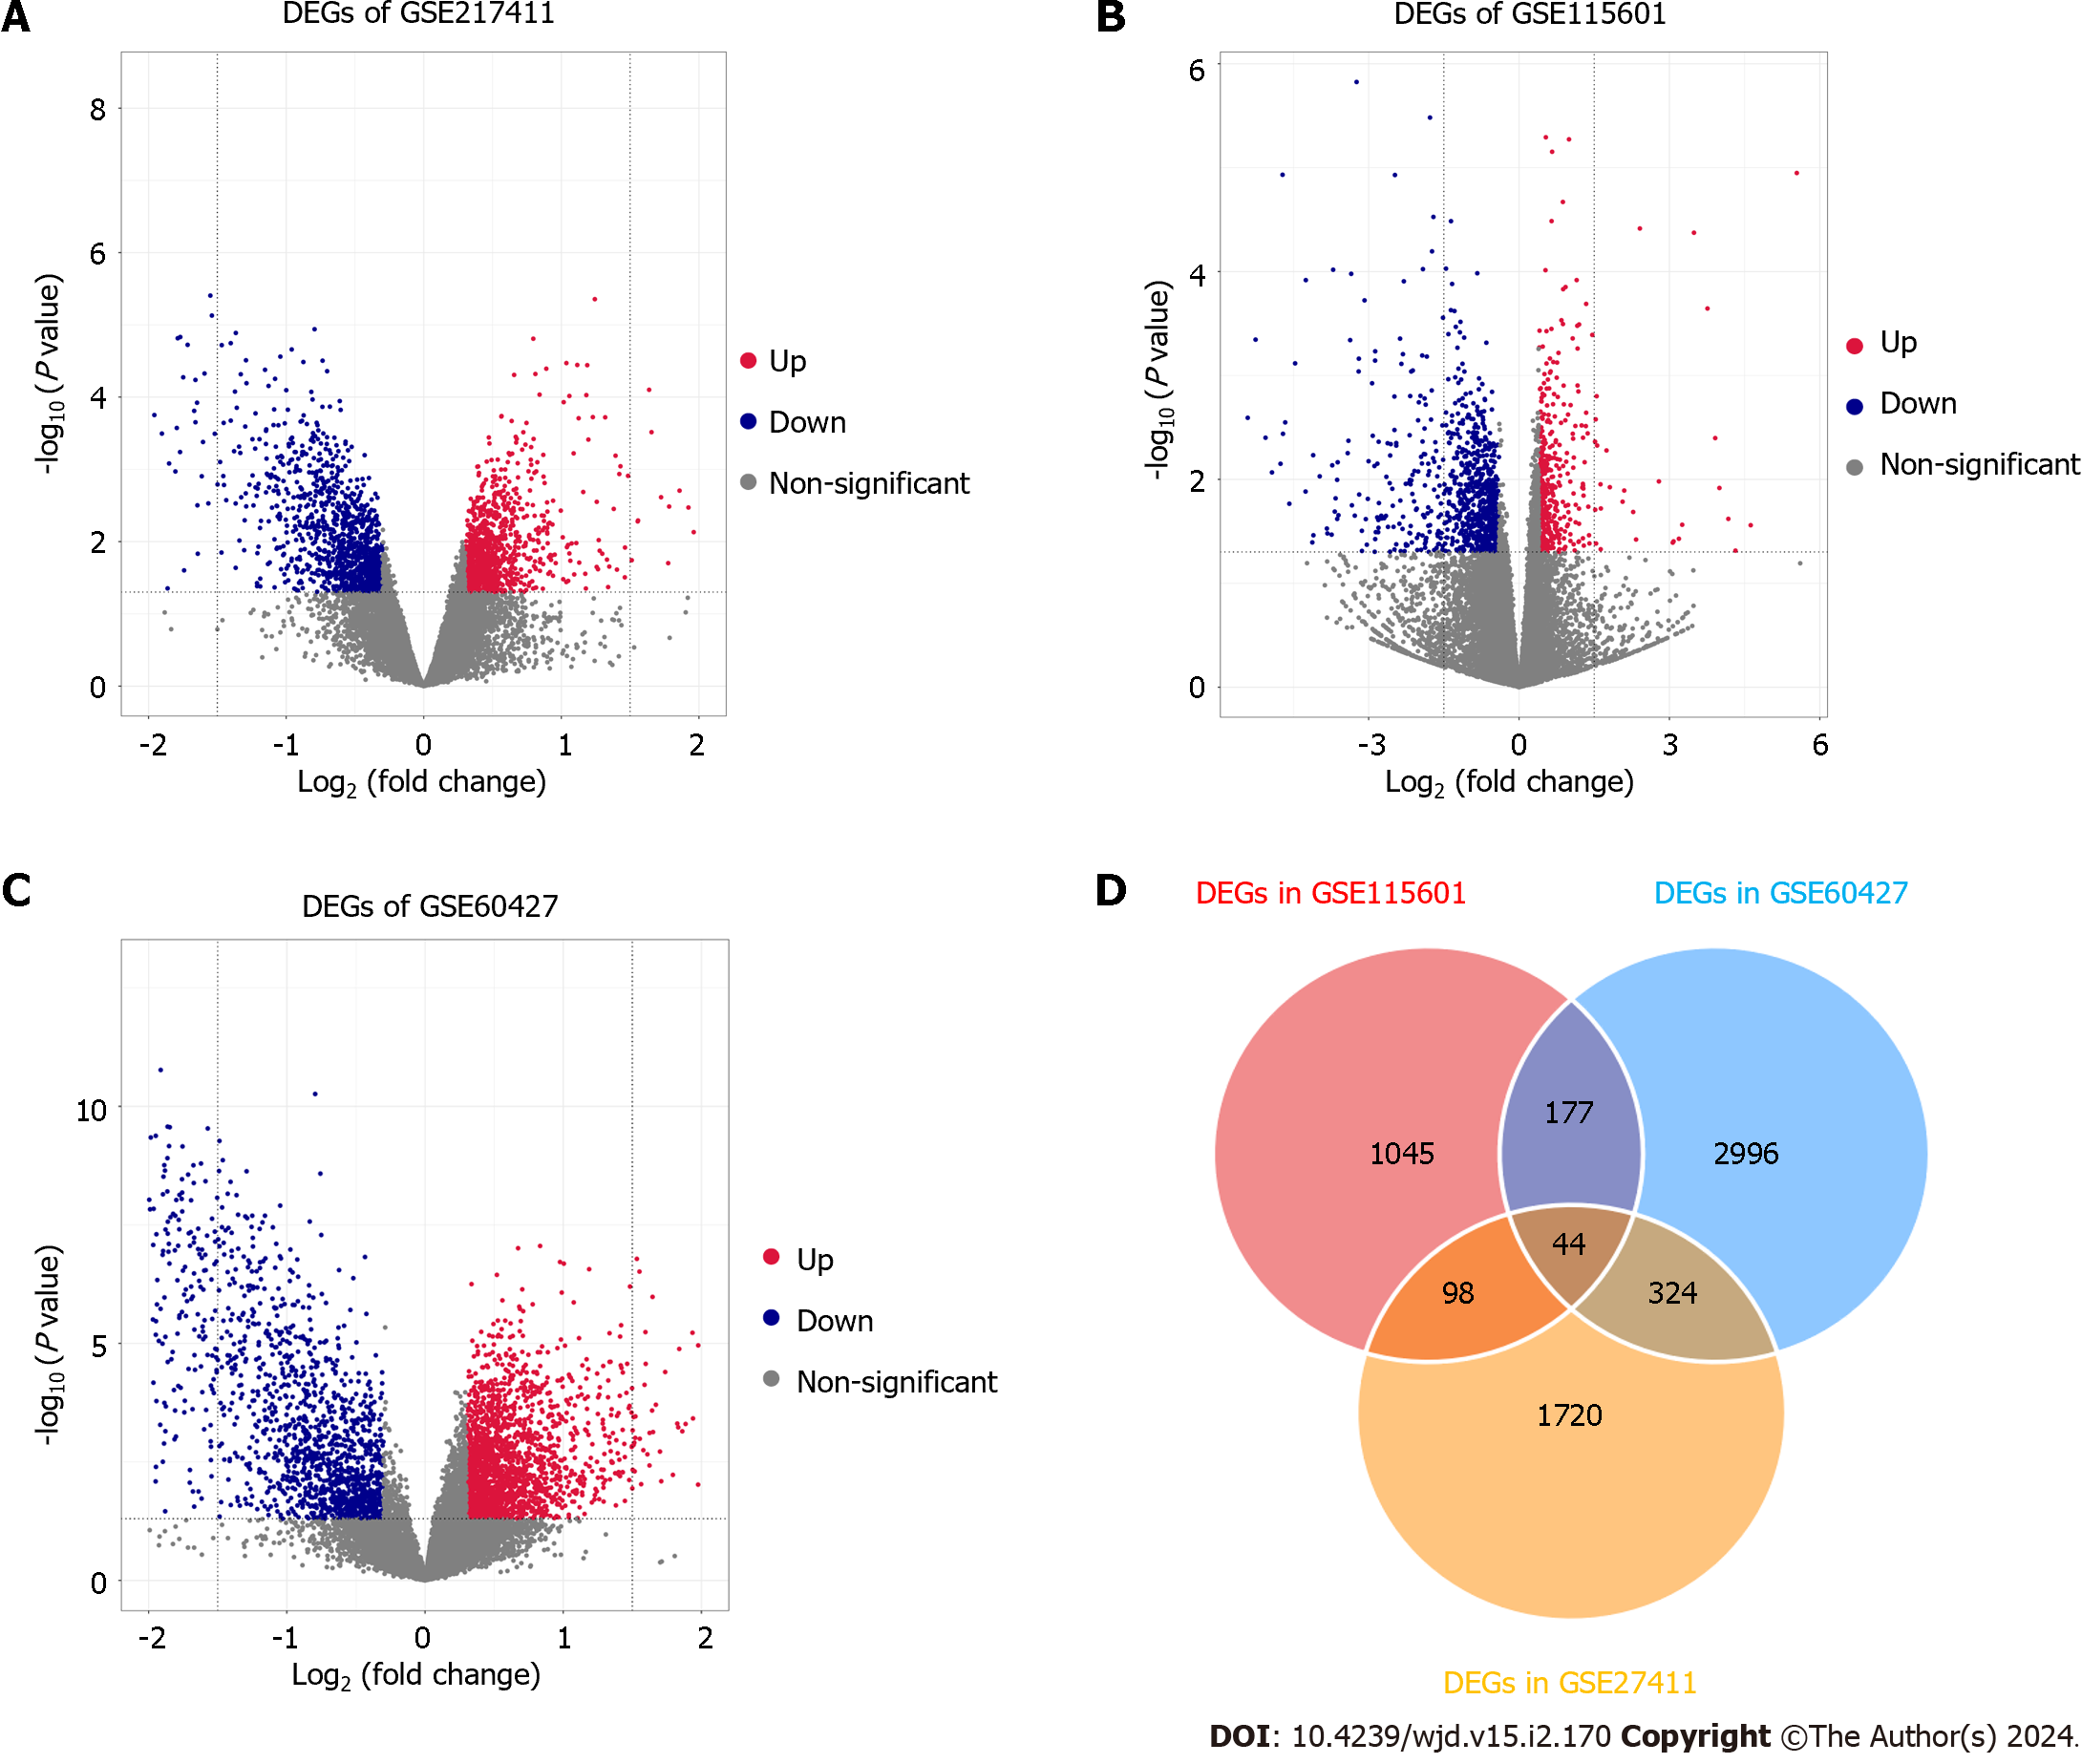
Figure 2 The expression levels of differentially expressed genes in three datasets.
A-C: The volcano plot distribution of differentially expressed genes (DEGs) of GSE60427 (A), GSE27411 (B) and GSE115601 (C). The blue dots indicate the screened downregulated DEGs, red dots indicate the screened upregulated DEGs, and the grey dots indicate genes with no significant differences; D: The Venn diagram of DEGs based on the three datasets. DEGs: Differentially expressed genes.
- Citation: Chen H, Zhang GX, Zhou XY. Identification of hub genes associated with Helicobacter pylori infection and type 2 diabetes mellitus: A pilot bioinformatics study. World J Diabetes 2024; 15(2): 170-185
- URL: https://www.wjgnet.com/1948-9358/full/v15/i2/170.htm
- DOI: https://dx.doi.org/10.4239/wjd.v15.i2.170


