Copyright
©The Author(s) 2024.
World J Diabetes. Nov 15, 2024; 15(11): 2203-2219
Published online Nov 15, 2024. doi: 10.4239/wjd.v15.i11.2203
Published online Nov 15, 2024. doi: 10.4239/wjd.v15.i11.2203
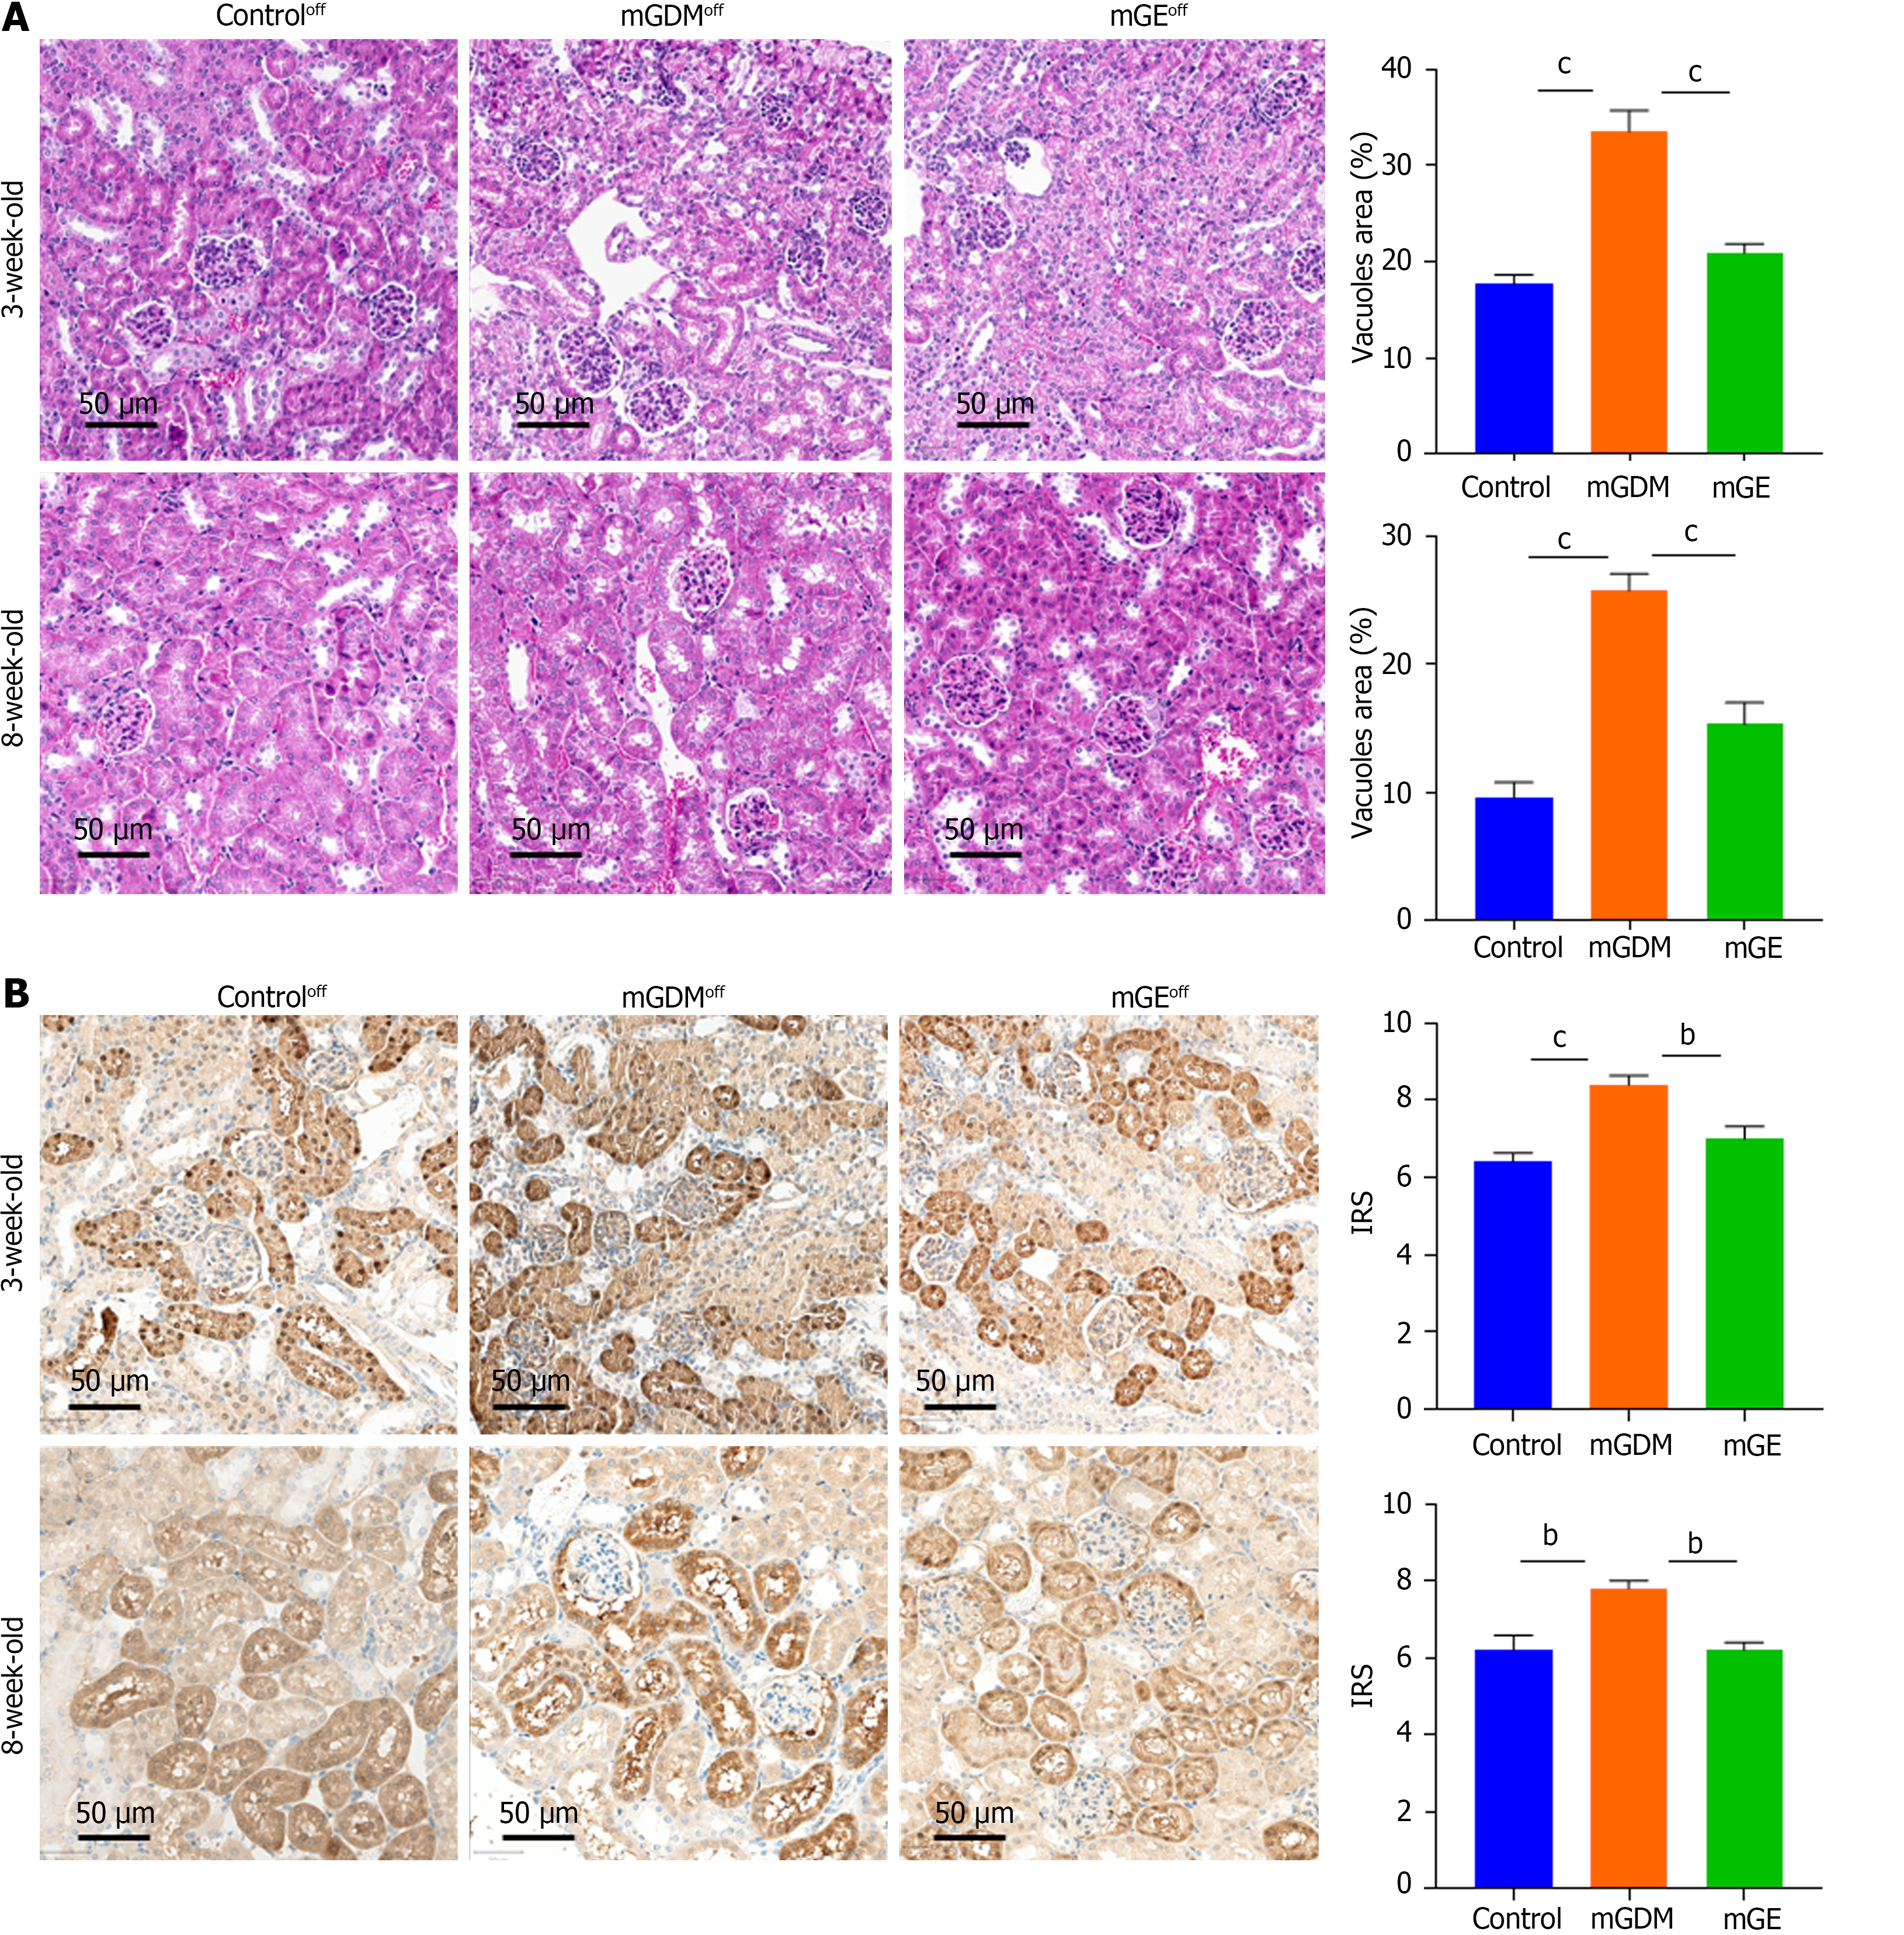
Figure 7 Development and glucose transporter 1 expression in kidneys of offspring in the offspring of control group, offspring of mouse with gestational diabetes mellitus group, and offspring of gestational diabetes mellitus mouse models with exercise group.
A: The hematoxylin and eosin staining of vacuole area for the kidneys of 3- and 8-wk-old offspring. Scale bar = 50 μm; B. Immunohistochemistry analysis of glucose transporter 1 expression in the kidneys of 3- and 8-week-old offspring. Scale bar = 50 μm. Offspring of control group (n = 5); Offspring of mouse with gestational diabetes mellitus group (n = 5); Offspring of gestational diabetes mellitus mouse models with exercise group (n = 5). Data are presented as the mean ± SEM. aP < 0.05; bP < 0.01; cP < 0.001. mGDM: Mouse with gestational diabetes mellitus; mGE: Gestational diabetes mellitus mouse models with exercise.
- Citation: Tang YB, Wang LS, Wu YH, Zhang LX, Hu LY, Wu Q, Zhou ML, Liang ZX. Effect of exercise during pregnancy on offspring development through ameliorating high glucose and hypoxia in gestational diabetes mellitus. World J Diabetes 2024; 15(11): 2203-2219
- URL: https://www.wjgnet.com/1948-9358/full/v15/i11/2203.htm
- DOI: https://dx.doi.org/10.4239/wjd.v15.i11.2203


