Copyright
©The Author(s) 2024.
World J Diabetes. Nov 15, 2024; 15(11): 2203-2219
Published online Nov 15, 2024. doi: 10.4239/wjd.v15.i11.2203
Published online Nov 15, 2024. doi: 10.4239/wjd.v15.i11.2203
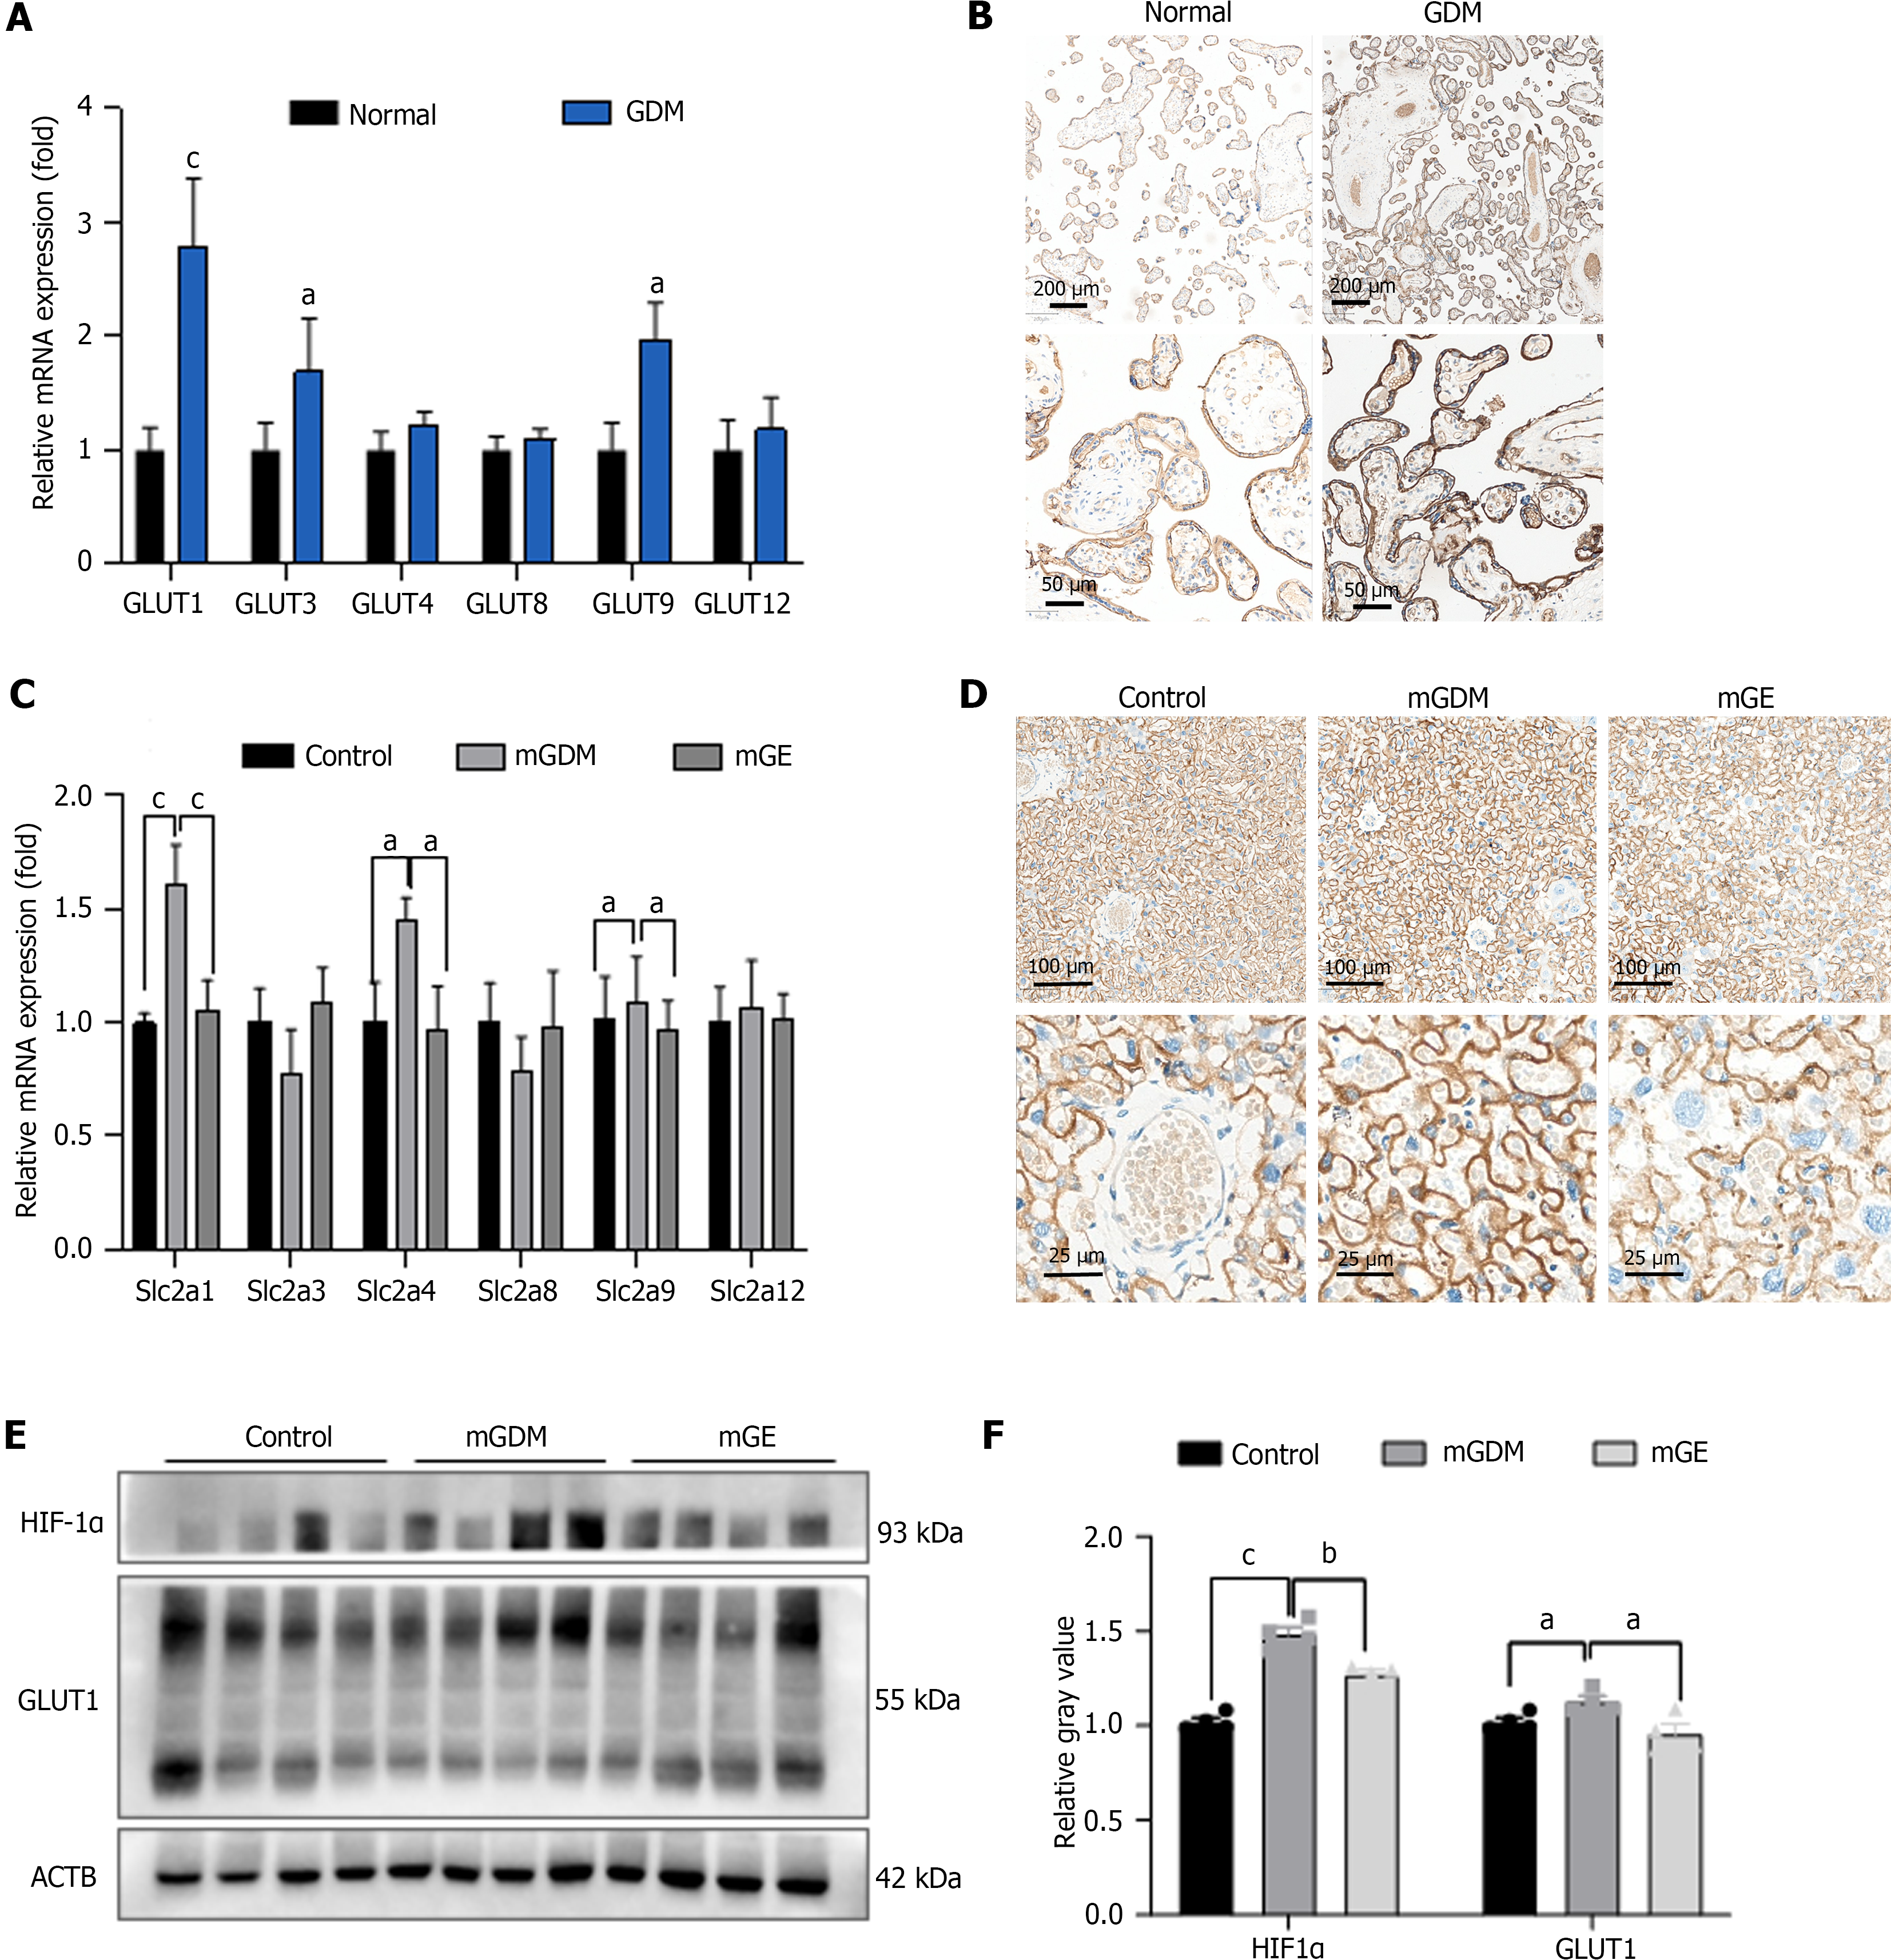
Figure 1 The expression of glucose transporter in placentas of humans and mice.
A: Reverse-transcriptase polymerase chain reaction (RT-PCR) analysis results of glucose transporter (GLUT) 1, 3, 4, 8, 9, and 12 expression levels in human placenta,normal (n = 20), GDM (n = 20),; B: The immunohistochemistry analysis results of GLUT 1 expression in human placenta. Scale bar = 200 μm and 50 μm; C: The RT-PCR analysis results of slc2a1, slc2a3, slc2a4, slc2a8, slc2a9, and slc2a12 expression in mice placenta, control (n= 5), mGDM (n = 5), and mGE (n = 5); D: Immunohistochemistry analysis results of GLUT 1 expression in mice placenta. Scale bar = 100 μm and 25μm; E: Western blot analysis results of hypoxia inducible factor-1α (HIF-1α), GLUT 1 expression in mice placenta; Relative gray value of HIF-1α, GLUT1 expression in the control, mGDM and mGE groups. Data are presented as the mean ± SEM. aP < 0.05; bP < 0.01; cP < 0.001. GLUT: Glucose transporter; HIF-1α: Hypoxia inducible factor-1α; GDM: Gestational diabetes mellitus; mGDM: Mouse with gestational diabetes mellitus; ACTB: β-Actin.
- Citation: Tang YB, Wang LS, Wu YH, Zhang LX, Hu LY, Wu Q, Zhou ML, Liang ZX. Effect of exercise during pregnancy on offspring development through ameliorating high glucose and hypoxia in gestational diabetes mellitus. World J Diabetes 2024; 15(11): 2203-2219
- URL: https://www.wjgnet.com/1948-9358/full/v15/i11/2203.htm
- DOI: https://dx.doi.org/10.4239/wjd.v15.i11.2203


