Copyright
©The Author(s) 2024.
World J Diabetes. Oct 15, 2024; 15(10): 2147-2151
Published online Oct 15, 2024. doi: 10.4239/wjd.v15.i10.2147
Published online Oct 15, 2024. doi: 10.4239/wjd.v15.i10.2147
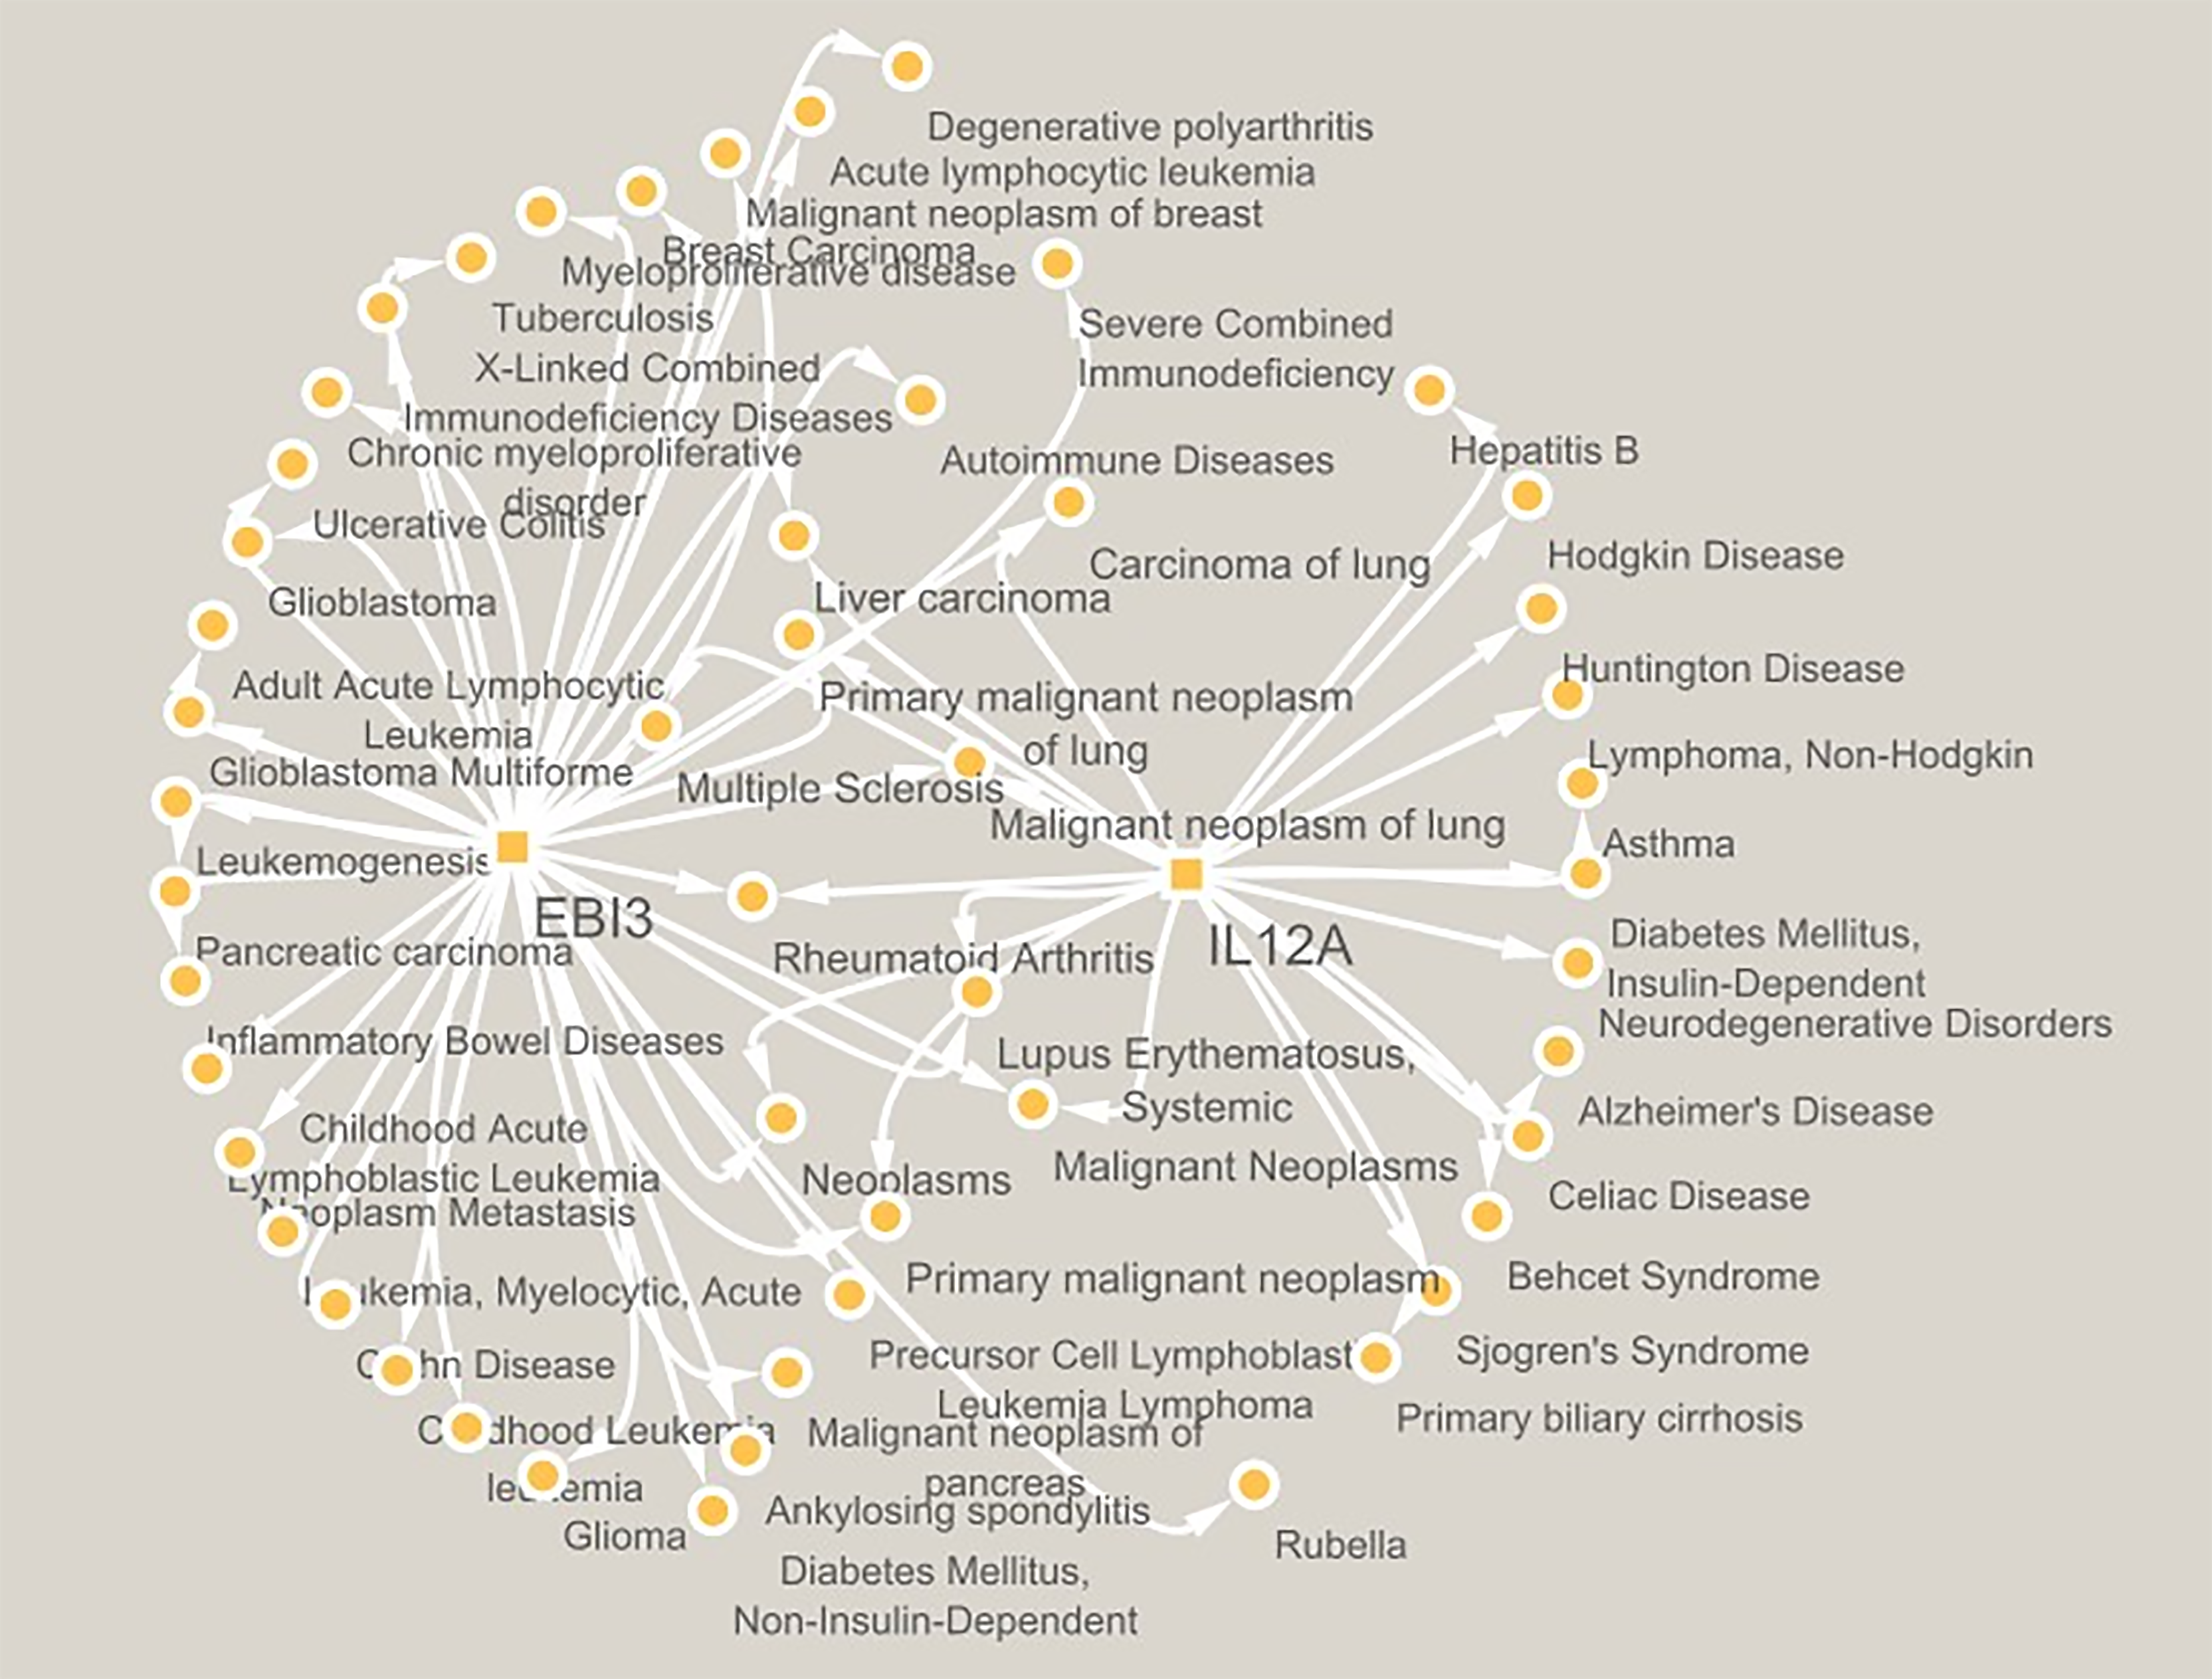
Figure 1 Schematic representation of interleukin-12A and Epstein–Barr virus-induced 3 individually and mutually networked with different diseases by white solid lines.
Data were collected from the PubMed database. The disease-gene association is searched in the DisGeNET database v 7.0 for gene-disease associations, whereas the "N_PMIDs (citation)" ≥ 3 were considered, and a gene-disease target network was created and analyzed using CYTOSCAPE version 3.10.0. Schematic representation of networking in Figure 1, in which interleukin-12A and Epstein–Barr virus-induced 3 are found to be individually and mutually networked by solid white lines.
- Citation: Chakraborty R, Mukherjee AK, Bala A. Interleukin-35: A key player managing pre-diabetes and chronic inflammatory type 1 autoimmune diabetes. World J Diabetes 2024; 15(10): 2147-2151
- URL: https://www.wjgnet.com/1948-9358/full/v15/i10/2147.htm
- DOI: https://dx.doi.org/10.4239/wjd.v15.i10.2147


