Copyright
©The Author(s) 2024.
World J Diabetes. Oct 15, 2024; 15(10): 2093-2110
Published online Oct 15, 2024. doi: 10.4239/wjd.v15.i10.2093
Published online Oct 15, 2024. doi: 10.4239/wjd.v15.i10.2093
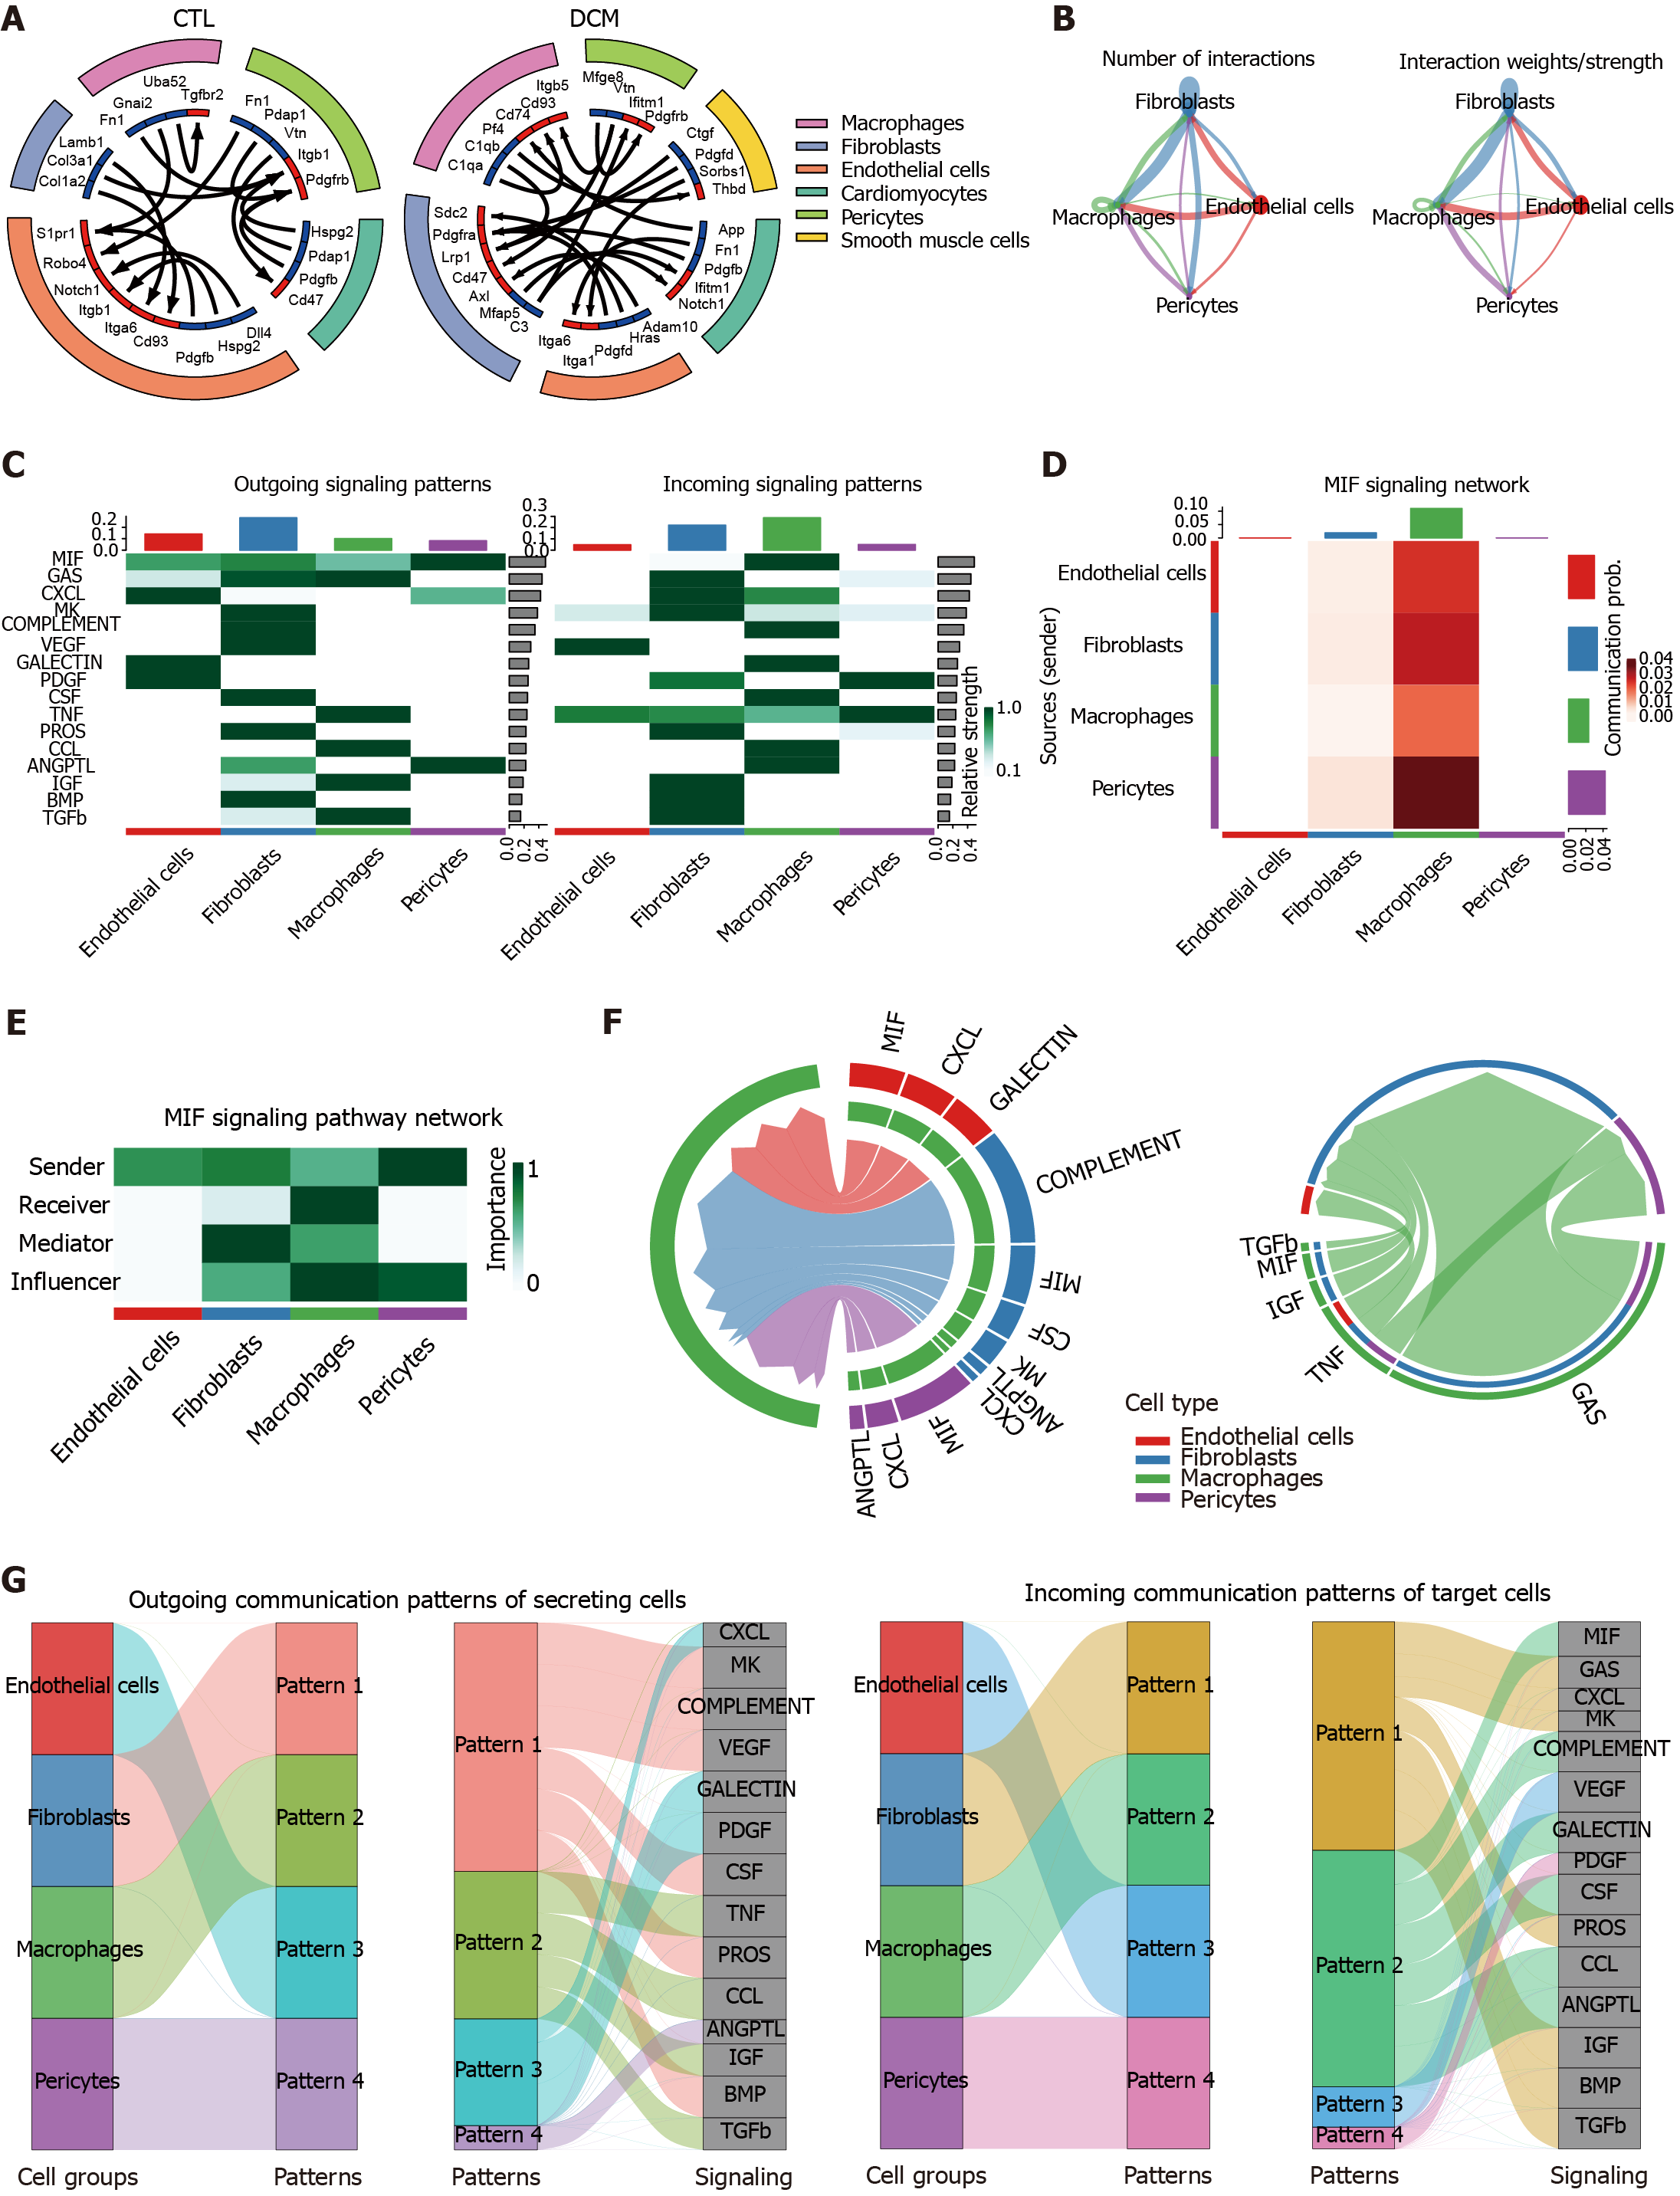
Figure 8 Analysis of cell-cell signaling pathway networks and communication patterns in diabetic cardiomyopathy.
A: The circle plot shows the cell-cell communication analysis of the control (CTL) and diabetic cardiomyopathy (DCM) groups, with the ligand color in blue and the receptor color in red; B: The circle plot depicting the aggregated cell-cell communication network in DCM illustrates either the number of interactions or the total interaction strength (weights) between any two cell groups; C: A signaling role analysis was conducted on the aggregated cell-cell communication network across all signaling pathways to identify the signals contributing the most to outgoing or incoming signaling in specific cell groups. This was visualized using a combined heatmap, where each row corresponds to a signaling pathway; D: Heatmap visualizing the cell-cell communication network specifically based on the migration inhibitory factor (MIF) signaling pathways. The intensity of the color in each cell reflects the strength of the interaction between the corresponding cell groups. Each row corresponds to a sender cell group, and each column represents a receiver cell group; E: Heatmap displaying the computed centrality scores (importance) of cell groups in the intercellular communication network (dominant senders, receivers, mediators, and influencers) inferred from the MIF signaling pathway; F: Chord diagram illustrating the significant signaling pathways between selected source cell groups and target cell groups (source: Endothelial cells, fibroblasts, and pericytes, target: Macrophages) (left panel) in the intercellular communication network. The chords connecting the source and target arcs represent the significant signaling pathways between the corresponding cell groups; G: River plot to visualize associations of latent patterns (outgoing and incoming) with cell groups and signaling pathways. The specific communication patterns are defined by different colors in the network. MIF: Migration inhibitory factor; DCM: Diabetic cardiomyopathy; CTL: Control.
- Citation: Zheng ZQ, Cai DH, Song YF. Identification of immune feature genes and intercellular profiles in diabetic cardiomyopathy. World J Diabetes 2024; 15(10): 2093-2110
- URL: https://www.wjgnet.com/1948-9358/full/v15/i10/2093.htm
- DOI: https://dx.doi.org/10.4239/wjd.v15.i10.2093


