Copyright
©The Author(s) 2024.
World J Diabetes. Oct 15, 2024; 15(10): 2093-2110
Published online Oct 15, 2024. doi: 10.4239/wjd.v15.i10.2093
Published online Oct 15, 2024. doi: 10.4239/wjd.v15.i10.2093
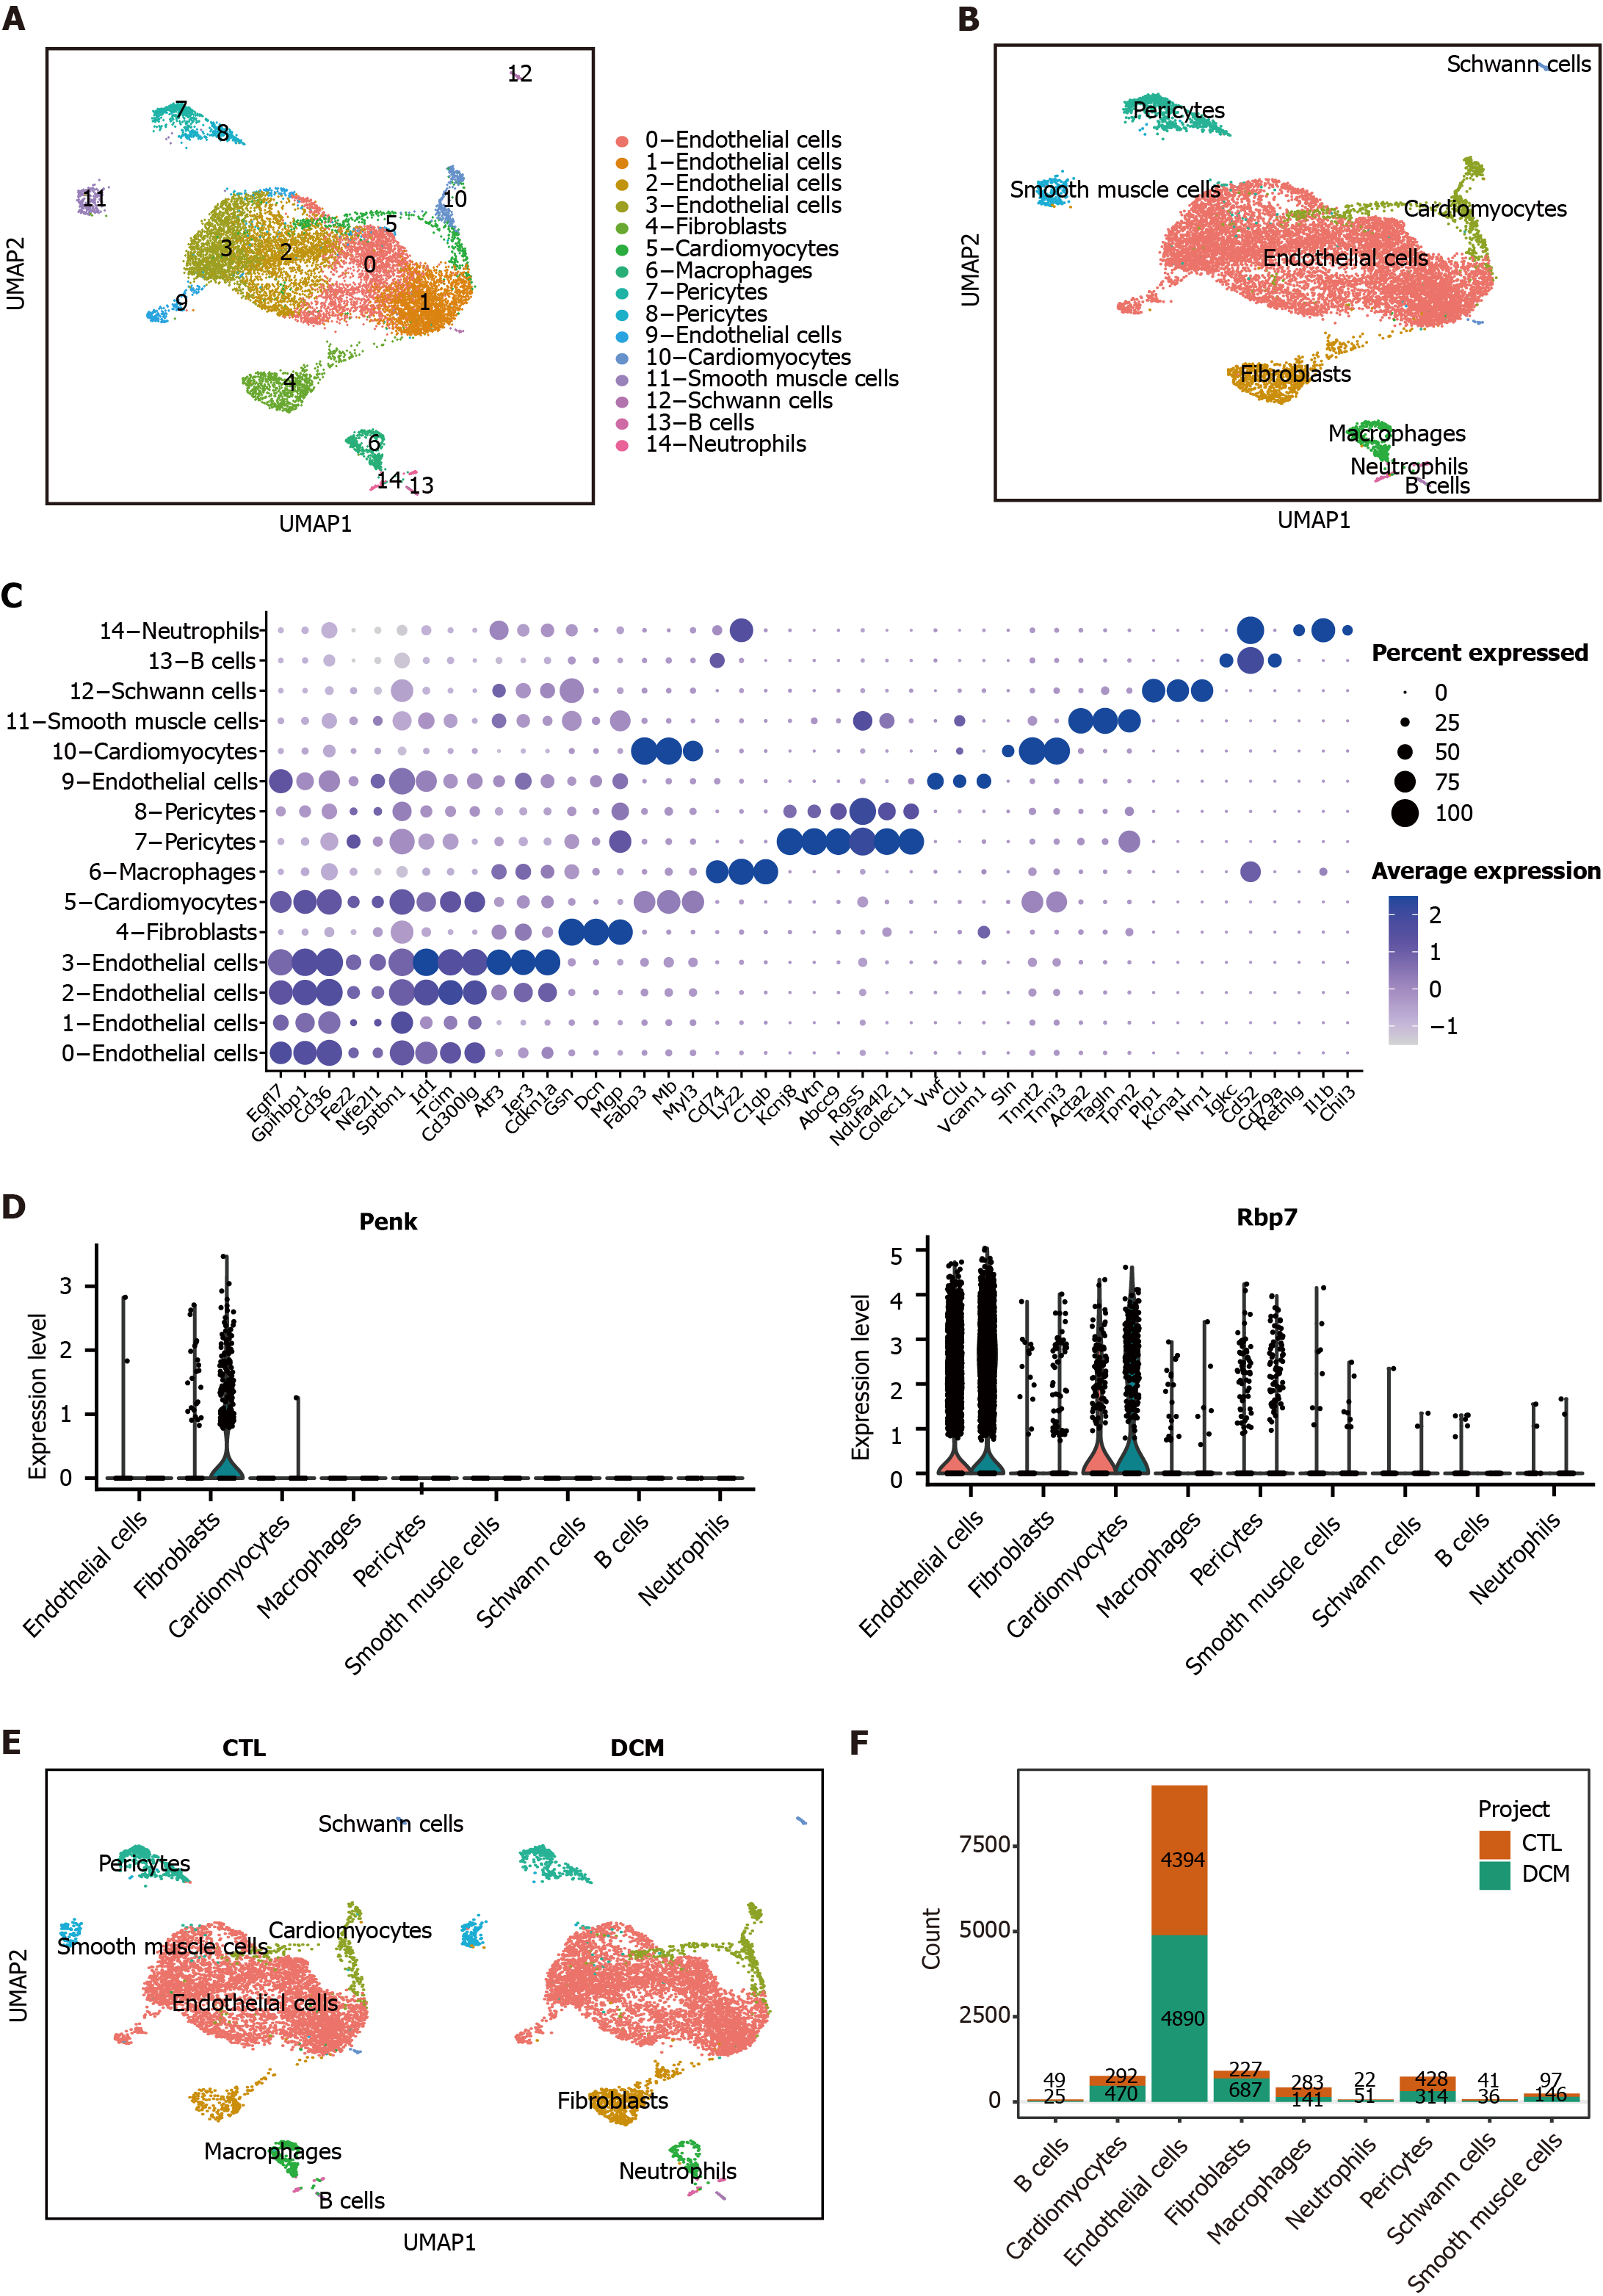
Figure 7 Analysis of the expression patterns of immune feature genes and cell-cell communication.
A: UMAP dimensionality reduction embedding was performed on the integrated dataset of single-cell RNA sequencing data from all profiled samples (n = 12593 cells). The embedding is color-coded by inferred cluster identity and annotated with manual cell type labels; B: Clusters with similar marker gene expression modules were merged and clustered into the same cell type; C: Dot plot showing cell-specific markers; D: Violin plots showing statistically significant feature gene (proenkephalin and retinol binding protein 7) expression values for each cell type, grouped by the donor of origin [control (CTL) and diabetic cardiomyopathy (DCM)]; E: UMAP for cell clusters grouped by the donor of origin (CTL or DCM); F: Bar chart representing the cell counts of different cell types in the two groups. DCM: Diabetic cardiomyopathy; CTL: Control; Penk: Proenkephalin; Gcgr: Glucagon receptor; Rbp7: Retinol binding protein 7; Inha: Inhibin subunit alpha.
- Citation: Zheng ZQ, Cai DH, Song YF. Identification of immune feature genes and intercellular profiles in diabetic cardiomyopathy. World J Diabetes 2024; 15(10): 2093-2110
- URL: https://www.wjgnet.com/1948-9358/full/v15/i10/2093.htm
- DOI: https://dx.doi.org/10.4239/wjd.v15.i10.2093


