Copyright
©The Author(s) 2024.
World J Diabetes. Oct 15, 2024; 15(10): 2093-2110
Published online Oct 15, 2024. doi: 10.4239/wjd.v15.i10.2093
Published online Oct 15, 2024. doi: 10.4239/wjd.v15.i10.2093
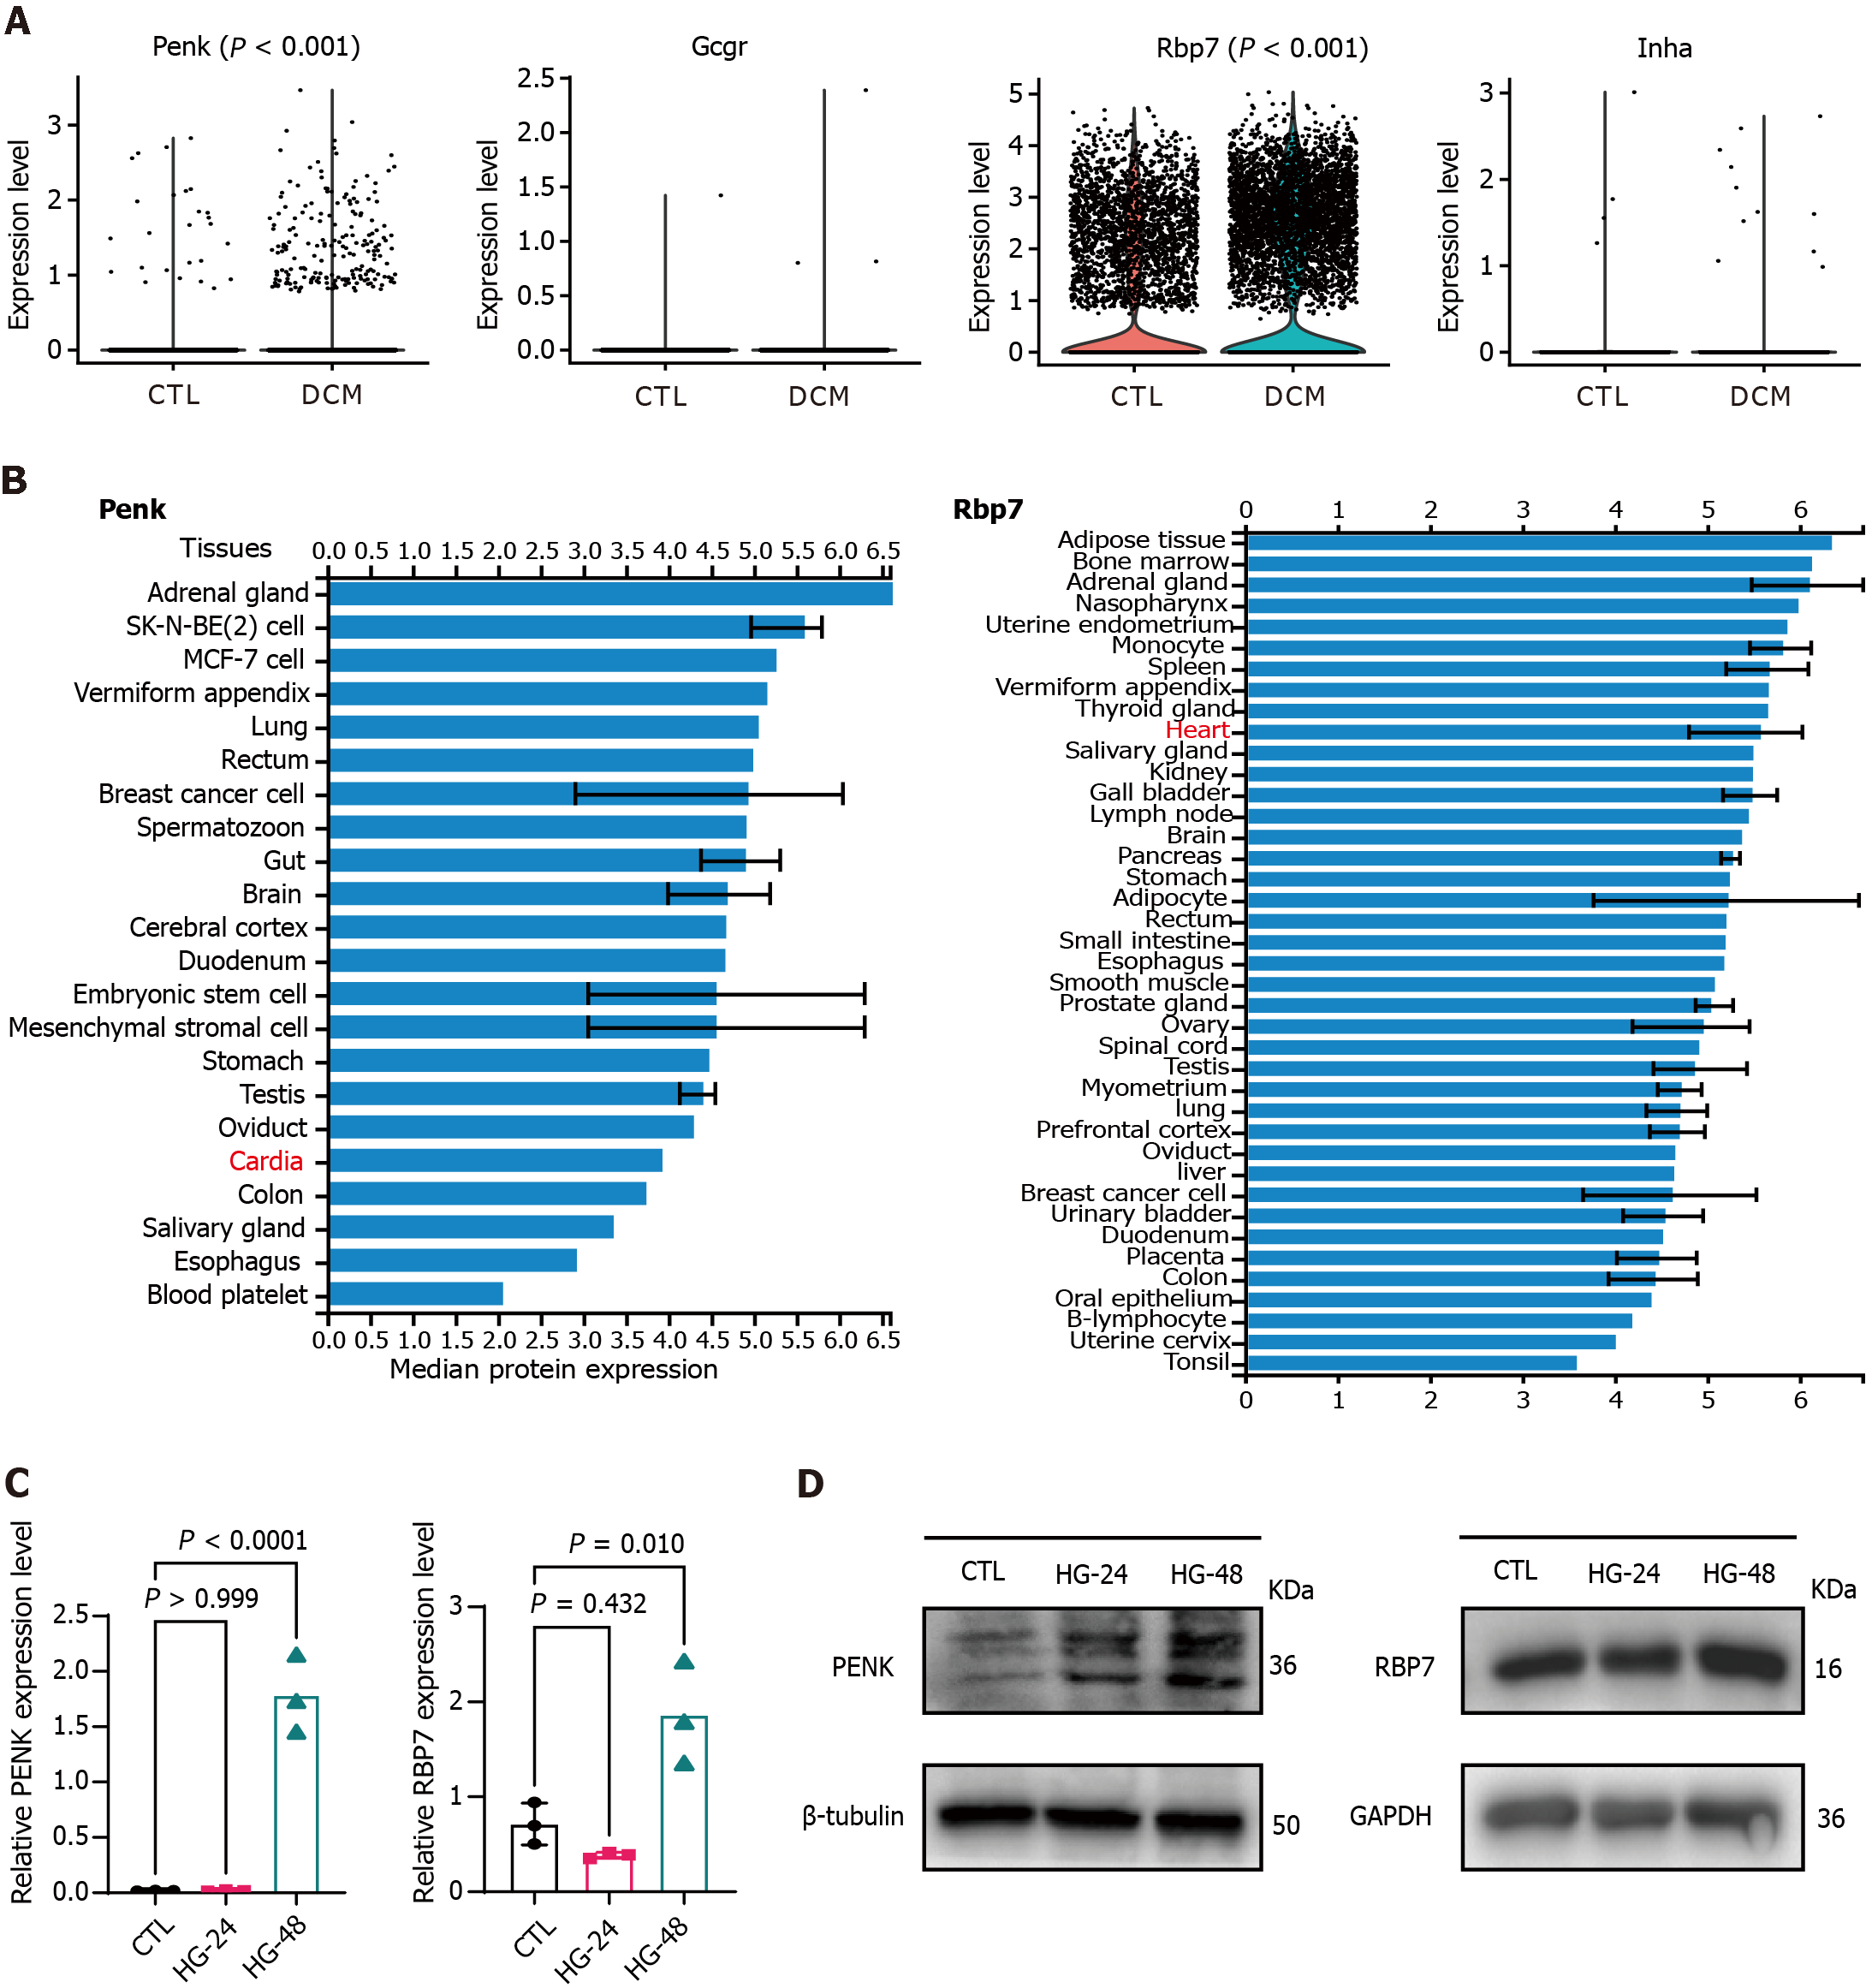
Figure 6 Expression levels of immune feature genes according to single-cell RNA sequencing data.
A: Violin plots comparing the expression levels of immune feature genes in control (CTL) (5833 cells) and diabetic cardiomyopathy (6760 cells) samples, with each point representing one cell; B: Tissue-specific expression of proenkephalin and retinol binding protein 7 in the ProteomicsDB repository; C: Relative gene expression levels in AC16 cells were examined using real time-quantitative polymerase chain reaction. Each point represents one independent biological experiment. HG-24 and HG-48, AC16 cells exposed to high glucose for 24 hours and 48 hours, respectively; D: Western blot showing the protein expression levels of the two genes. β-Tubulin and GAPDH were used as endogenous CTLs. DCM: Diabetic cardiomyopathy; CTL: Control; Penk: Proenkephalin; Gcgr: Glucagon receptor; Rbp7: Retinol binding protein 7; Inha: Inhibin subunit alpha.
- Citation: Zheng ZQ, Cai DH, Song YF. Identification of immune feature genes and intercellular profiles in diabetic cardiomyopathy. World J Diabetes 2024; 15(10): 2093-2110
- URL: https://www.wjgnet.com/1948-9358/full/v15/i10/2093.htm
- DOI: https://dx.doi.org/10.4239/wjd.v15.i10.2093


