Copyright
©The Author(s) 2024.
World J Diabetes. Oct 15, 2024; 15(10): 2093-2110
Published online Oct 15, 2024. doi: 10.4239/wjd.v15.i10.2093
Published online Oct 15, 2024. doi: 10.4239/wjd.v15.i10.2093
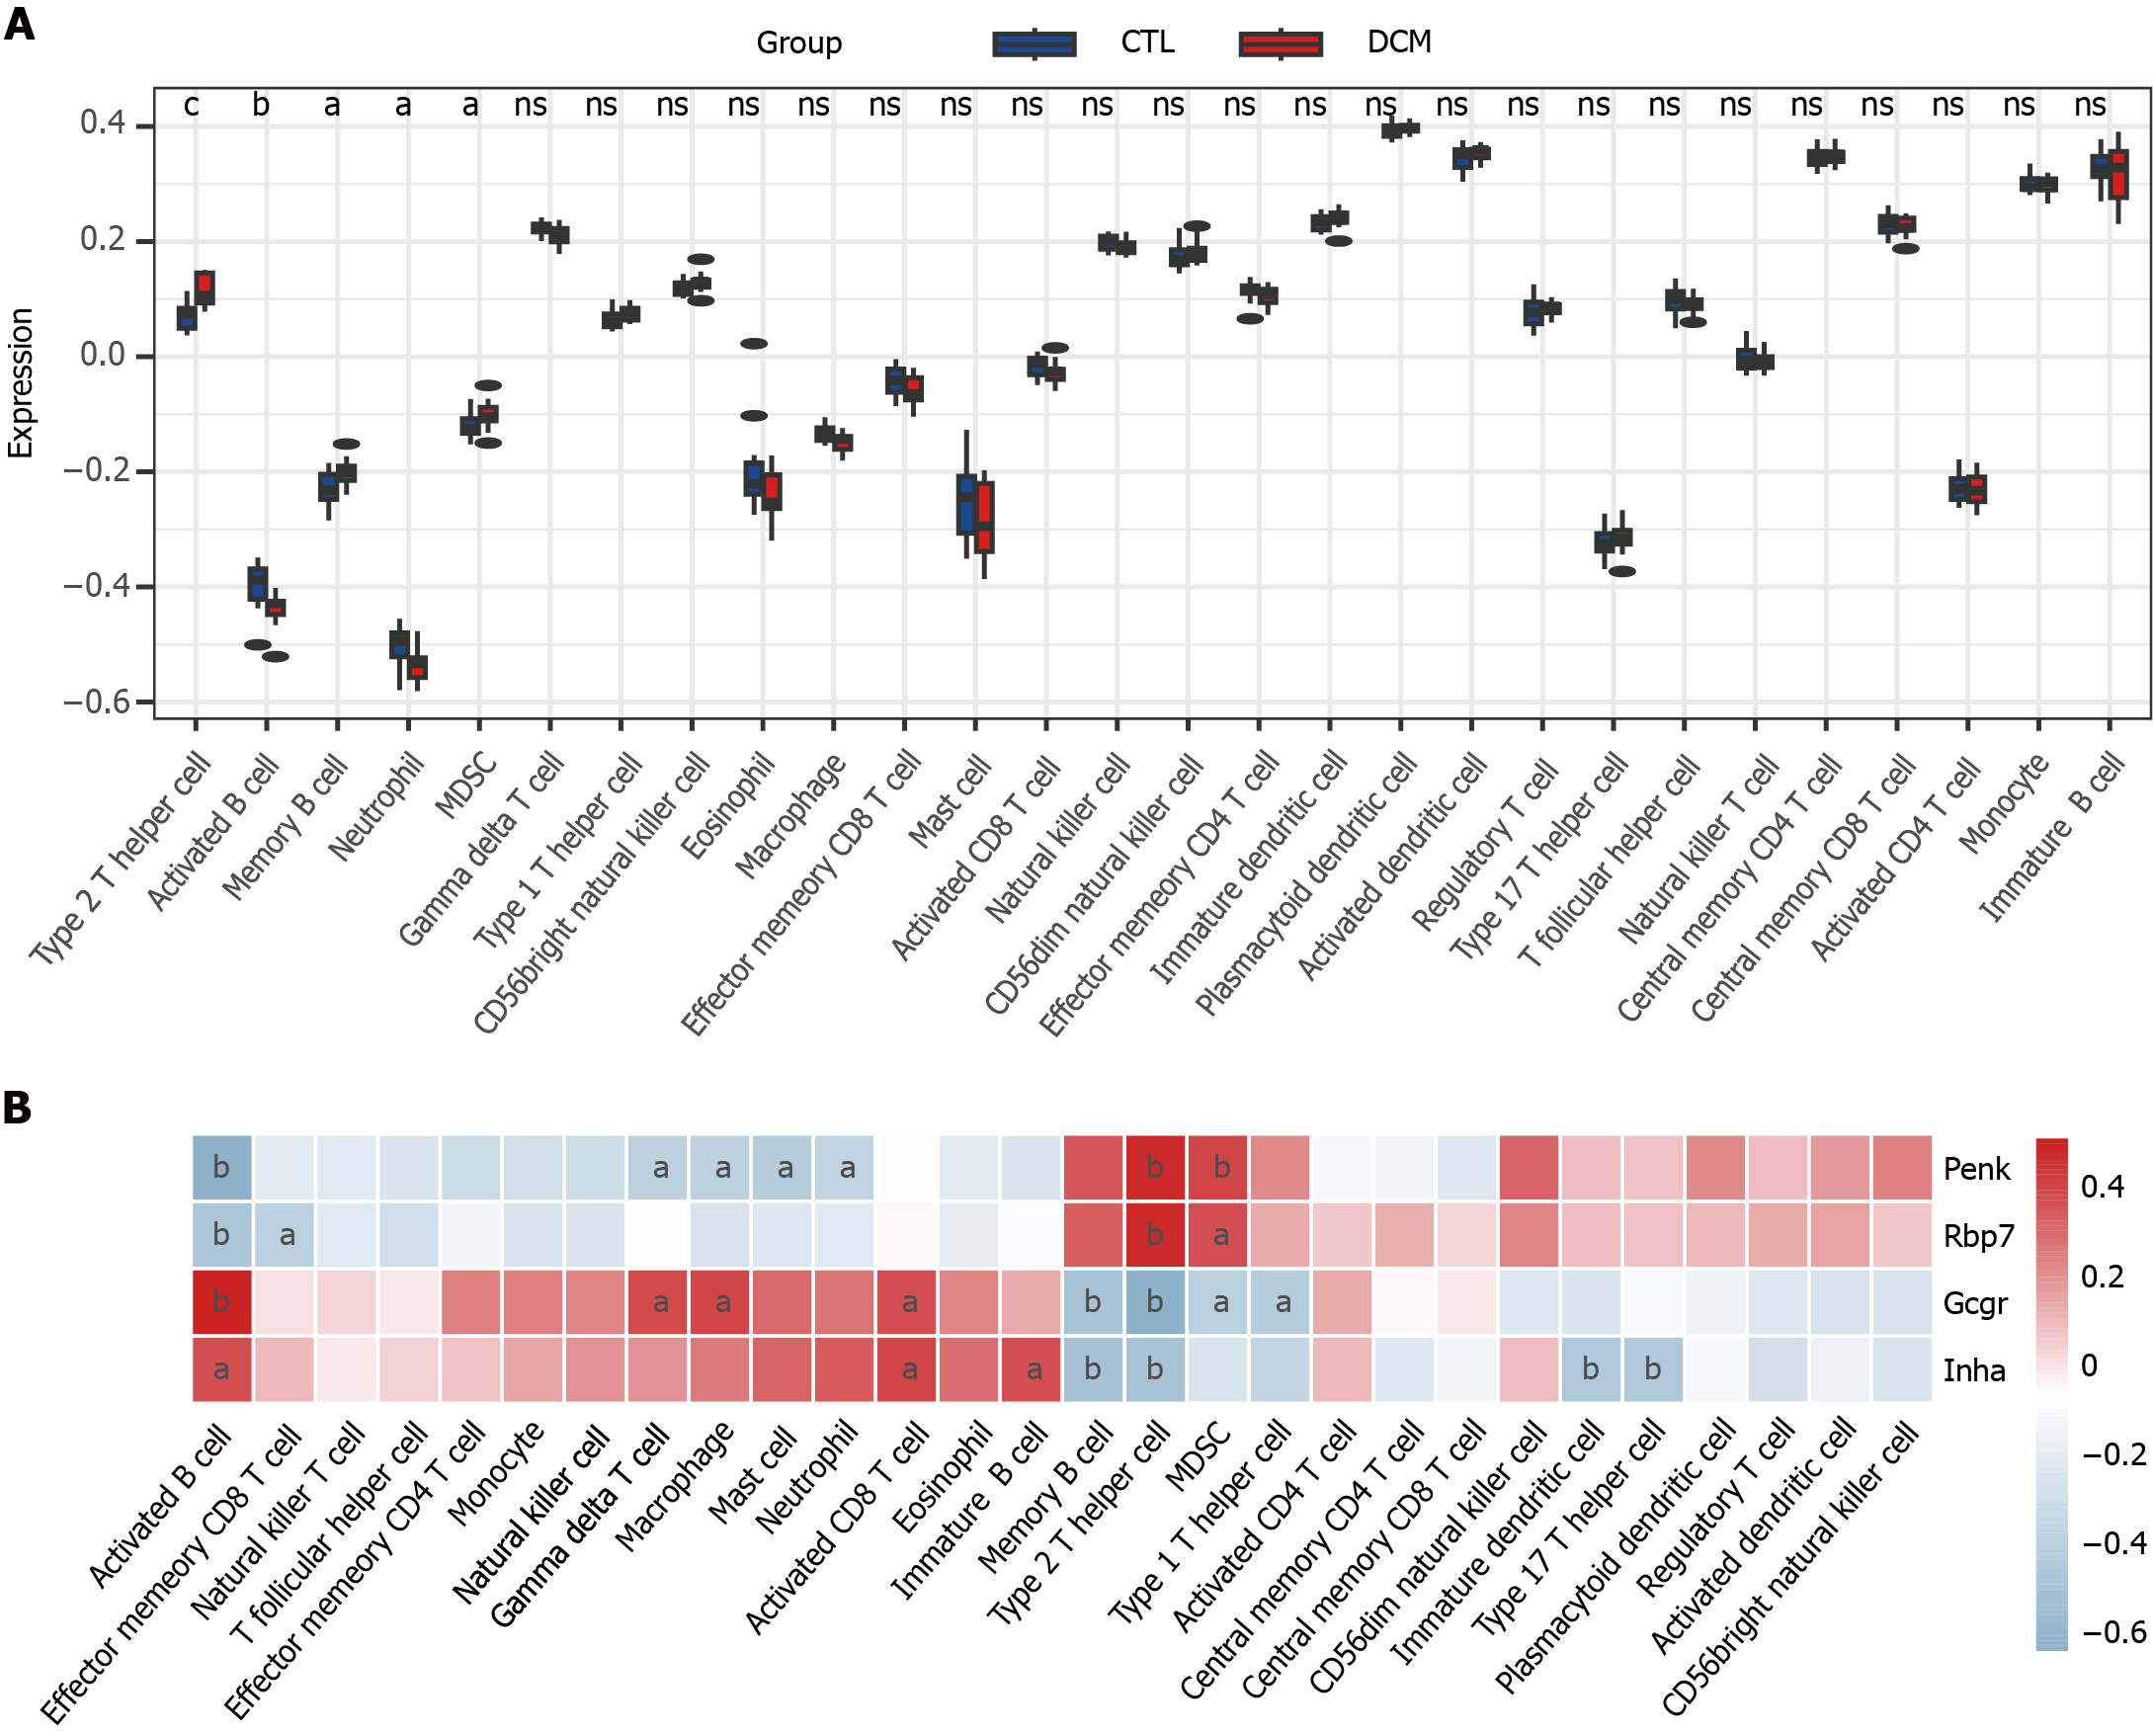
Figure 5 Single-sample gene set enrichment analysis was used to analyze immune cell infiltration in diabetic cardiomyopathy patients and its correlation with feature genes.
A: Box plot of immune scores for diabetic cardiomyopathy patients and control; B: Heatmap of the correlation between feature genes and immune cell infiltration. aP < 0.05, bP < 0.01 cP < 0.001. DCM: Diabetic cardiomyopathy; CTL: Control; Penk: Proenkephalin; Gcgr: Glucagon receptor; Rbp7: Retinol binding protein 7; Inha: Inhibin subunit alpha.
- Citation: Zheng ZQ, Cai DH, Song YF. Identification of immune feature genes and intercellular profiles in diabetic cardiomyopathy. World J Diabetes 2024; 15(10): 2093-2110
- URL: https://www.wjgnet.com/1948-9358/full/v15/i10/2093.htm
- DOI: https://dx.doi.org/10.4239/wjd.v15.i10.2093


