Copyright
©The Author(s) 2024.
World J Diabetes. Oct 15, 2024; 15(10): 2081-2092
Published online Oct 15, 2024. doi: 10.4239/wjd.v15.i10.2081
Published online Oct 15, 2024. doi: 10.4239/wjd.v15.i10.2081
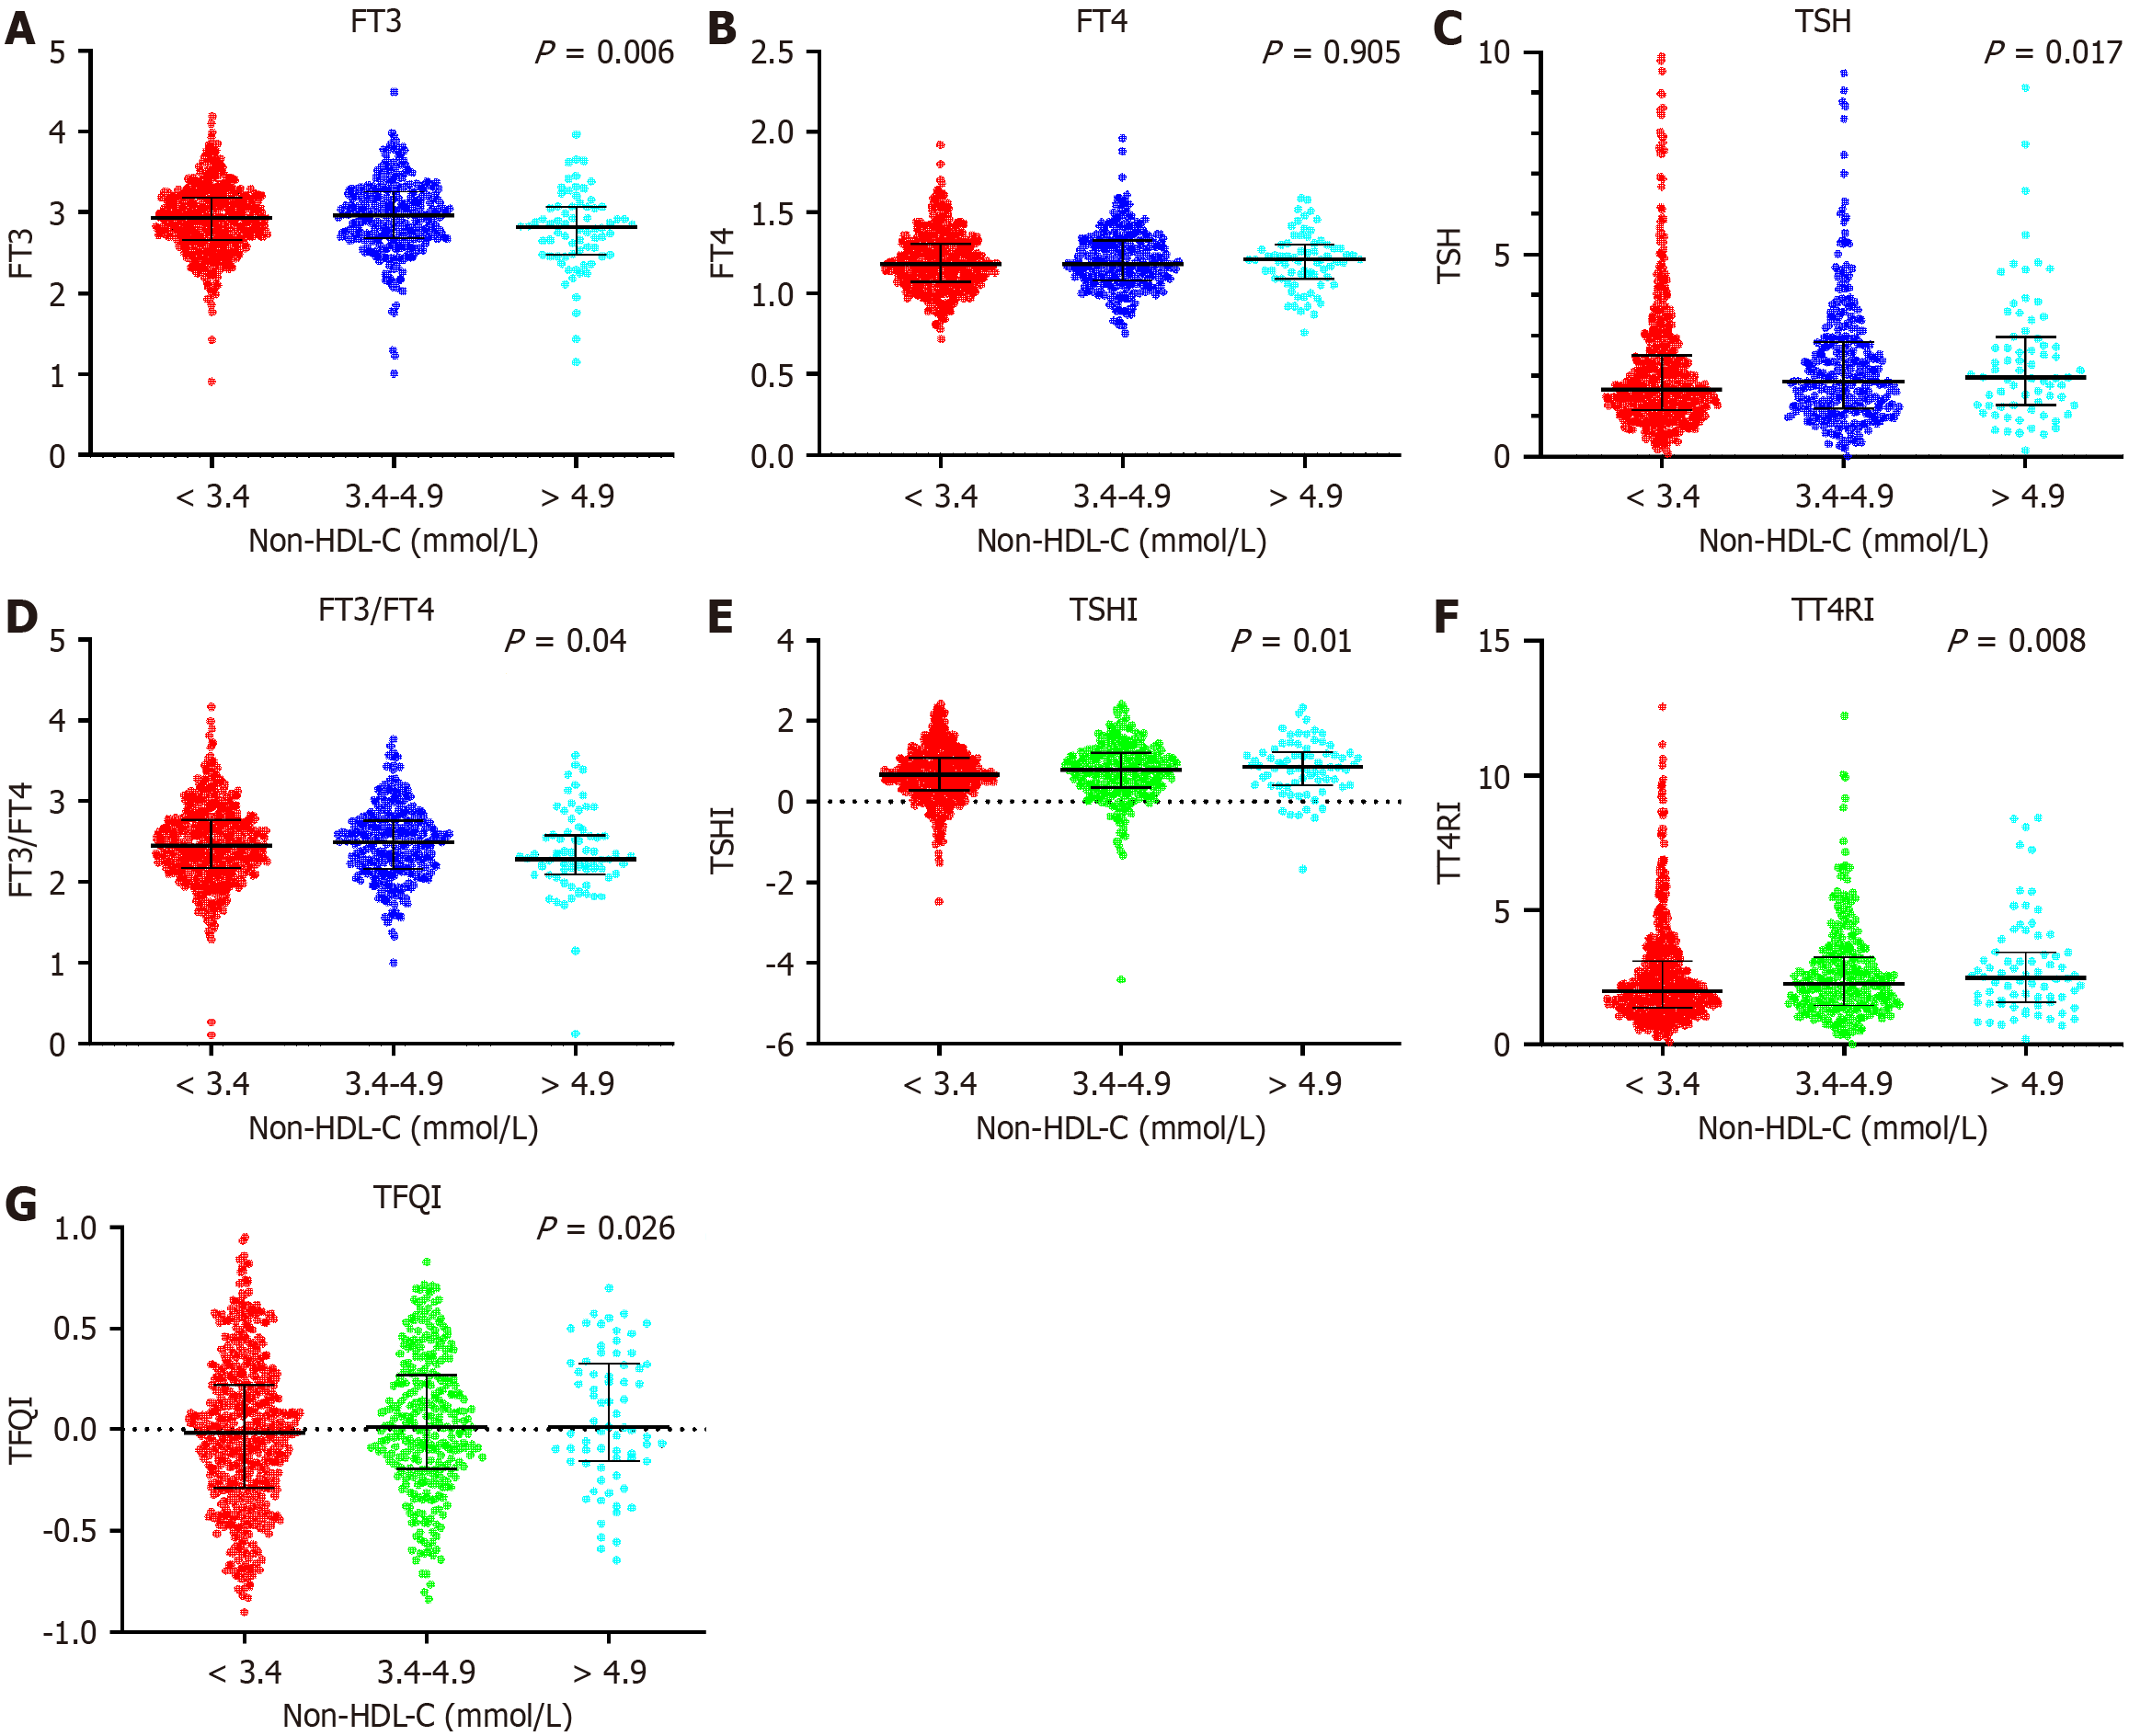
Figure 2 Comparison of thyroid-associated variables in different non-high-density lipoprotein cholesterol level groups.
Data were analyzed by Student t-test or Mann-Whitney U test. A: Free triiodothyronine (FT3); B: Free thyrotropin (FT4); C: Thyroid-stimulating hormone (TSH); D: FT3/FT4; E: TSH index; F: Thyrotrophic T4 resistance index; G: Thyroid feedback quantile-based index. Non-HDL-C: Non-high-density lipoprotein cholesterol; FT3: Free triiodothyronine; FT4: Free thyrotropin; TSH: Thyroid-stimulating hormone; TSHI: Thyroid-stimulating hormone index; TT4RI: Thyrotrophic T4 resistance index; TFQI: Thyroid feedback quantile-based index.
- Citation: Duan XY, Fu JL, Sun LN, Mu ZJ, Xiu SL. Association between sensitivity to thyroid hormones and non-high-density lipoprotein cholesterol levels in patients with type 2 diabetes mellitus. World J Diabetes 2024; 15(10): 2081-2092
- URL: https://www.wjgnet.com/1948-9358/full/v15/i10/2081.htm
- DOI: https://dx.doi.org/10.4239/wjd.v15.i10.2081


