Copyright
©The Author(s) 2024.
World J Diabetes. Jan 15, 2024; 15(1): 105-125
Published online Jan 15, 2024. doi: 10.4239/wjd.v15.i1.105
Published online Jan 15, 2024. doi: 10.4239/wjd.v15.i1.105
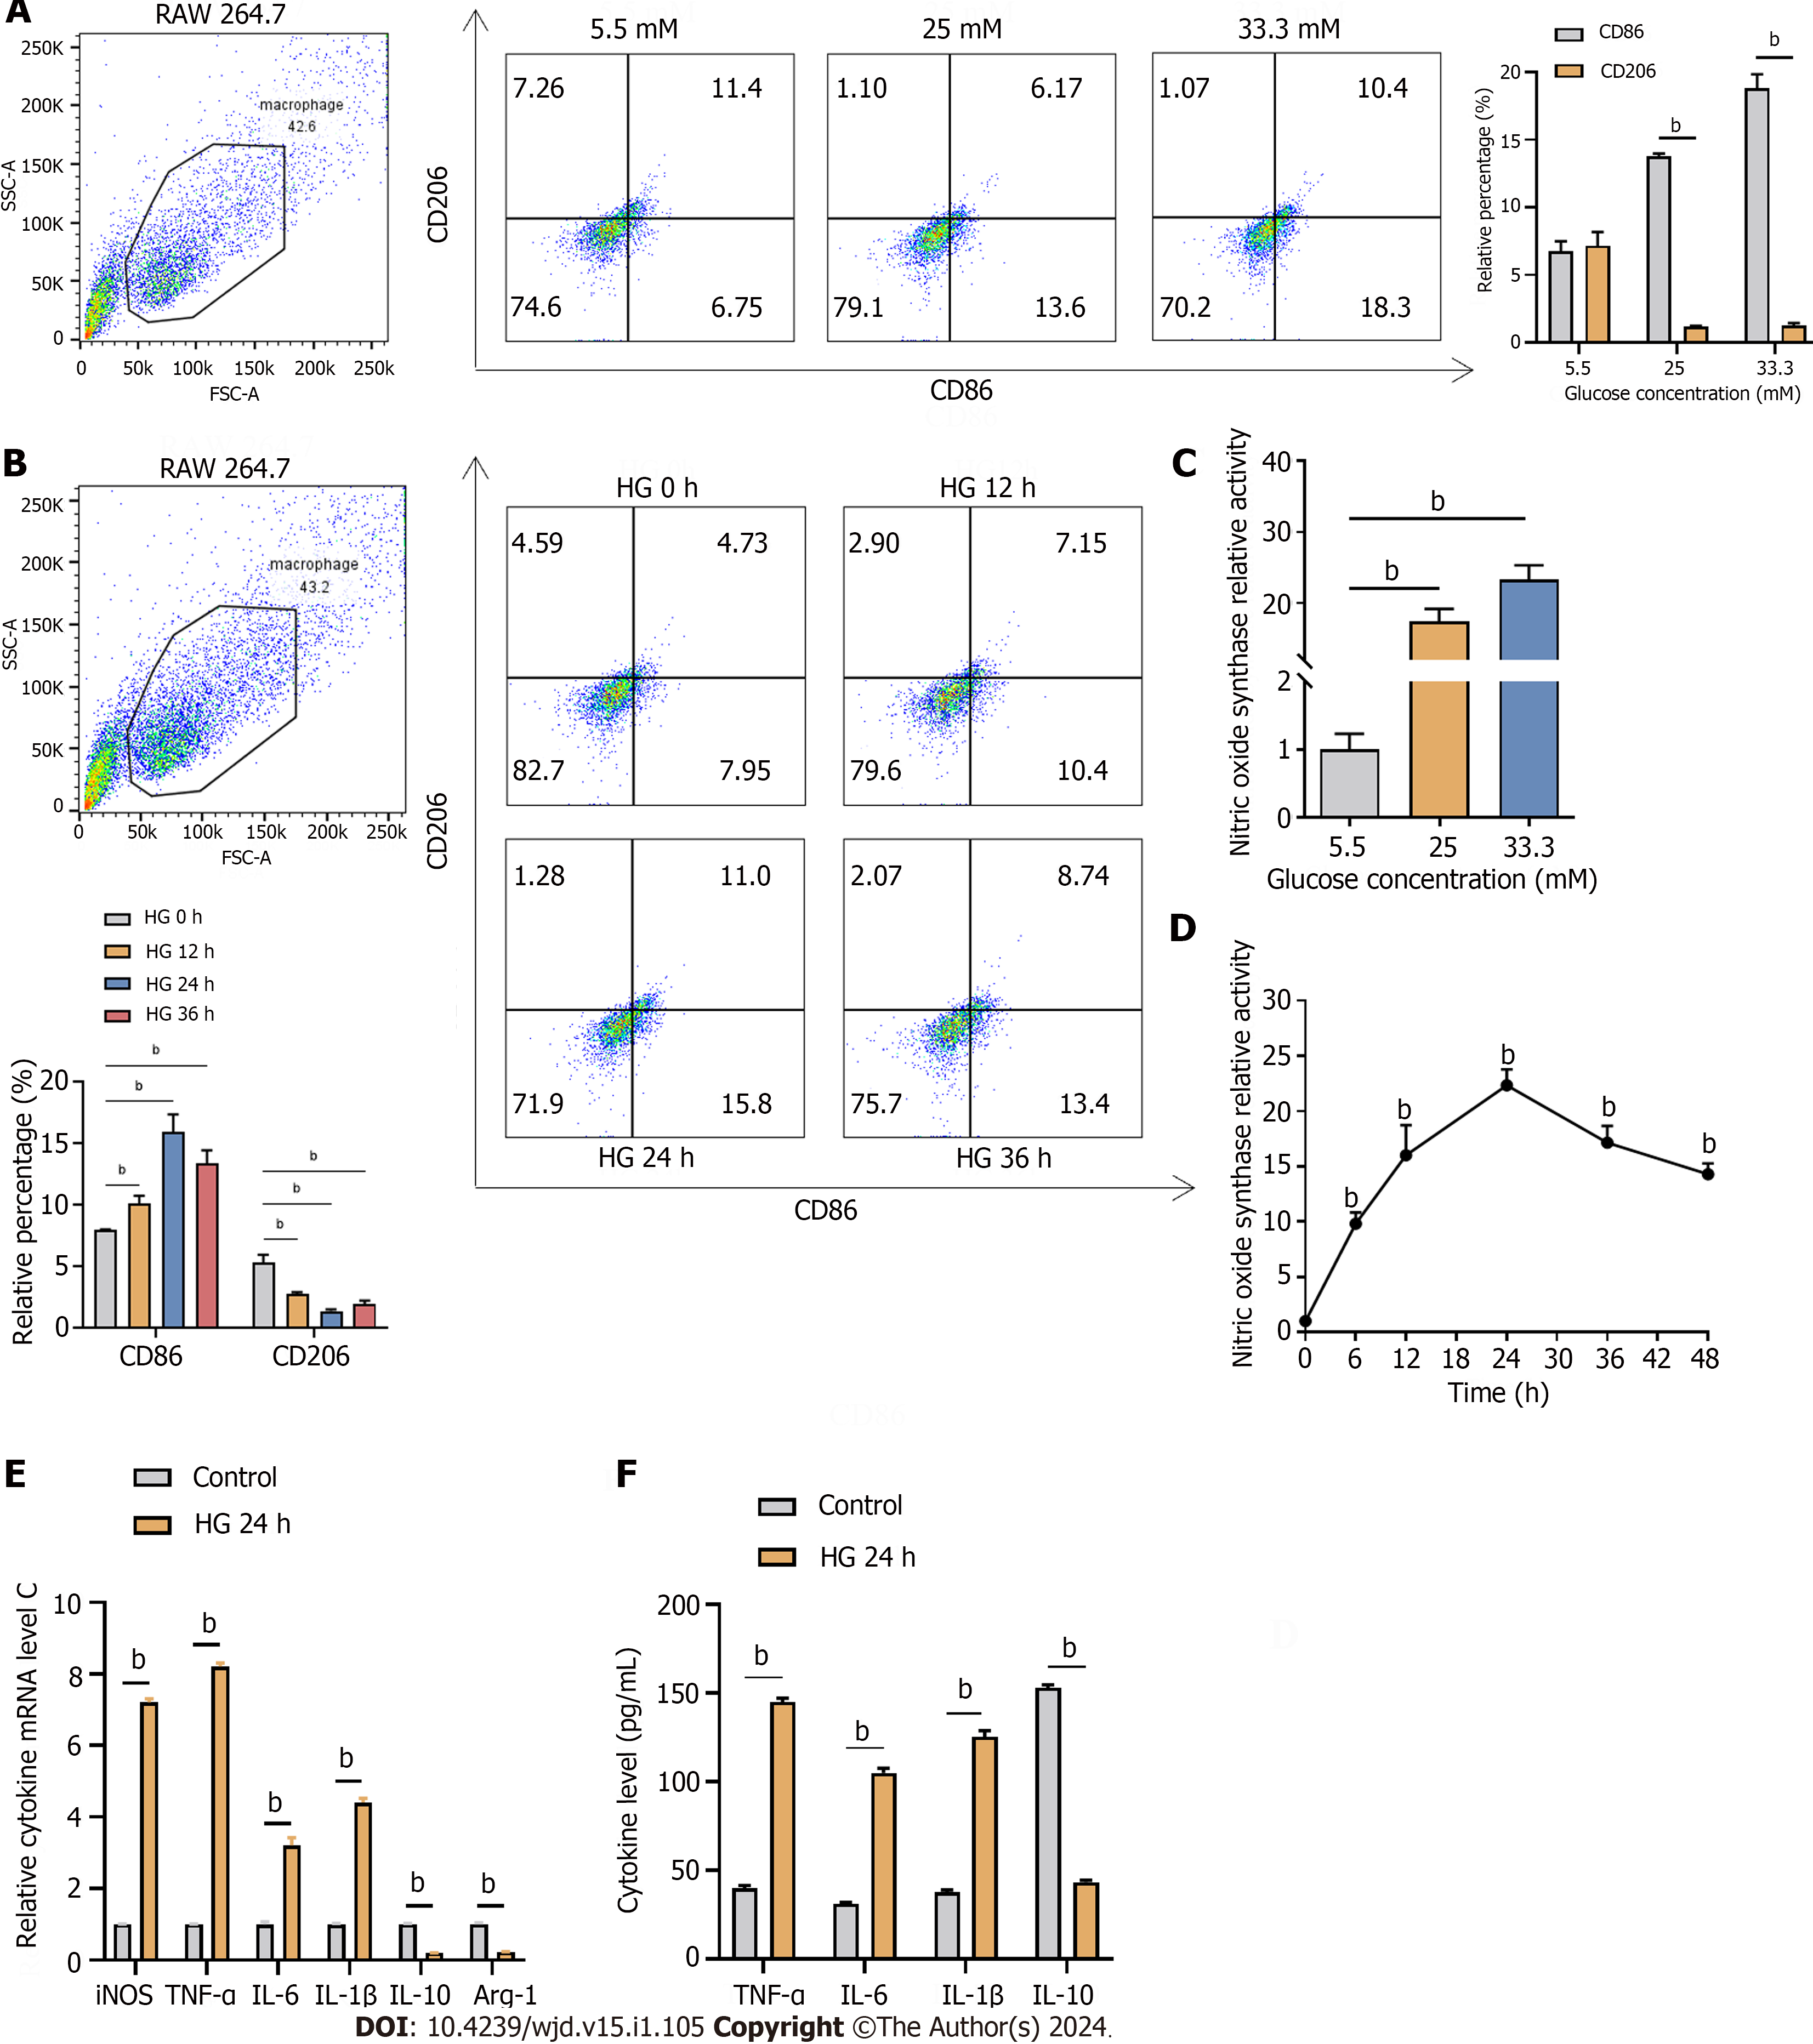
Figure 5 High glucose induced the M1 macrophage polarization of RAW 264.
7 cells. A and B: Flow cytometry analysis of RAW 264.7 macrophages labeled with CD86 and CD206 exposed to different concentrations of glucose (A) and to 33.3 mmol/L glucose for different times (B); C and D: Inducible nitric oxide synthase (iNOS) levels induced by different concentrations of glucose (C) and by 33.3 mmol/L glucose for different times (D); E and F: Relative cytokine mRNA (E) and protein (F) levels of iNOS, tumor necrosis factor-alpha, interleukin (IL)-6, IL-1β, IL-10, and arginase-1 after exposure to 33.3 mmol/L glucose for 24 h detected by reverse transcription-PCR (E) and western blotting (F). Arg-1: Arginase-1; TNF-α: Tumor necrosis factor-alpha; IL: Interleukin; iNOS: Inducible nitric oxide synthase; HG: High-glucose. bP < 0.05.
- Citation: Xu WL, Zhou PP, Yu X, Tian T, Bao JJ, Ni CR, Zha M, Wu X, Yu JY. Myricetin induces M2 macrophage polarization to alleviate renal tubulointerstitial fibrosis in diabetic nephropathy via PI3K/Akt pathway. World J Diabetes 2024; 15(1): 105-125
- URL: https://www.wjgnet.com/1948-9358/full/v15/i1/105.htm
- DOI: https://dx.doi.org/10.4239/wjd.v15.i1.105


