Copyright
©The Author(s) 2023.
World J Diabetes. Sep 15, 2023; 14(9): 1369-1384
Published online Sep 15, 2023. doi: 10.4239/wjd.v14.i9.1369
Published online Sep 15, 2023. doi: 10.4239/wjd.v14.i9.1369
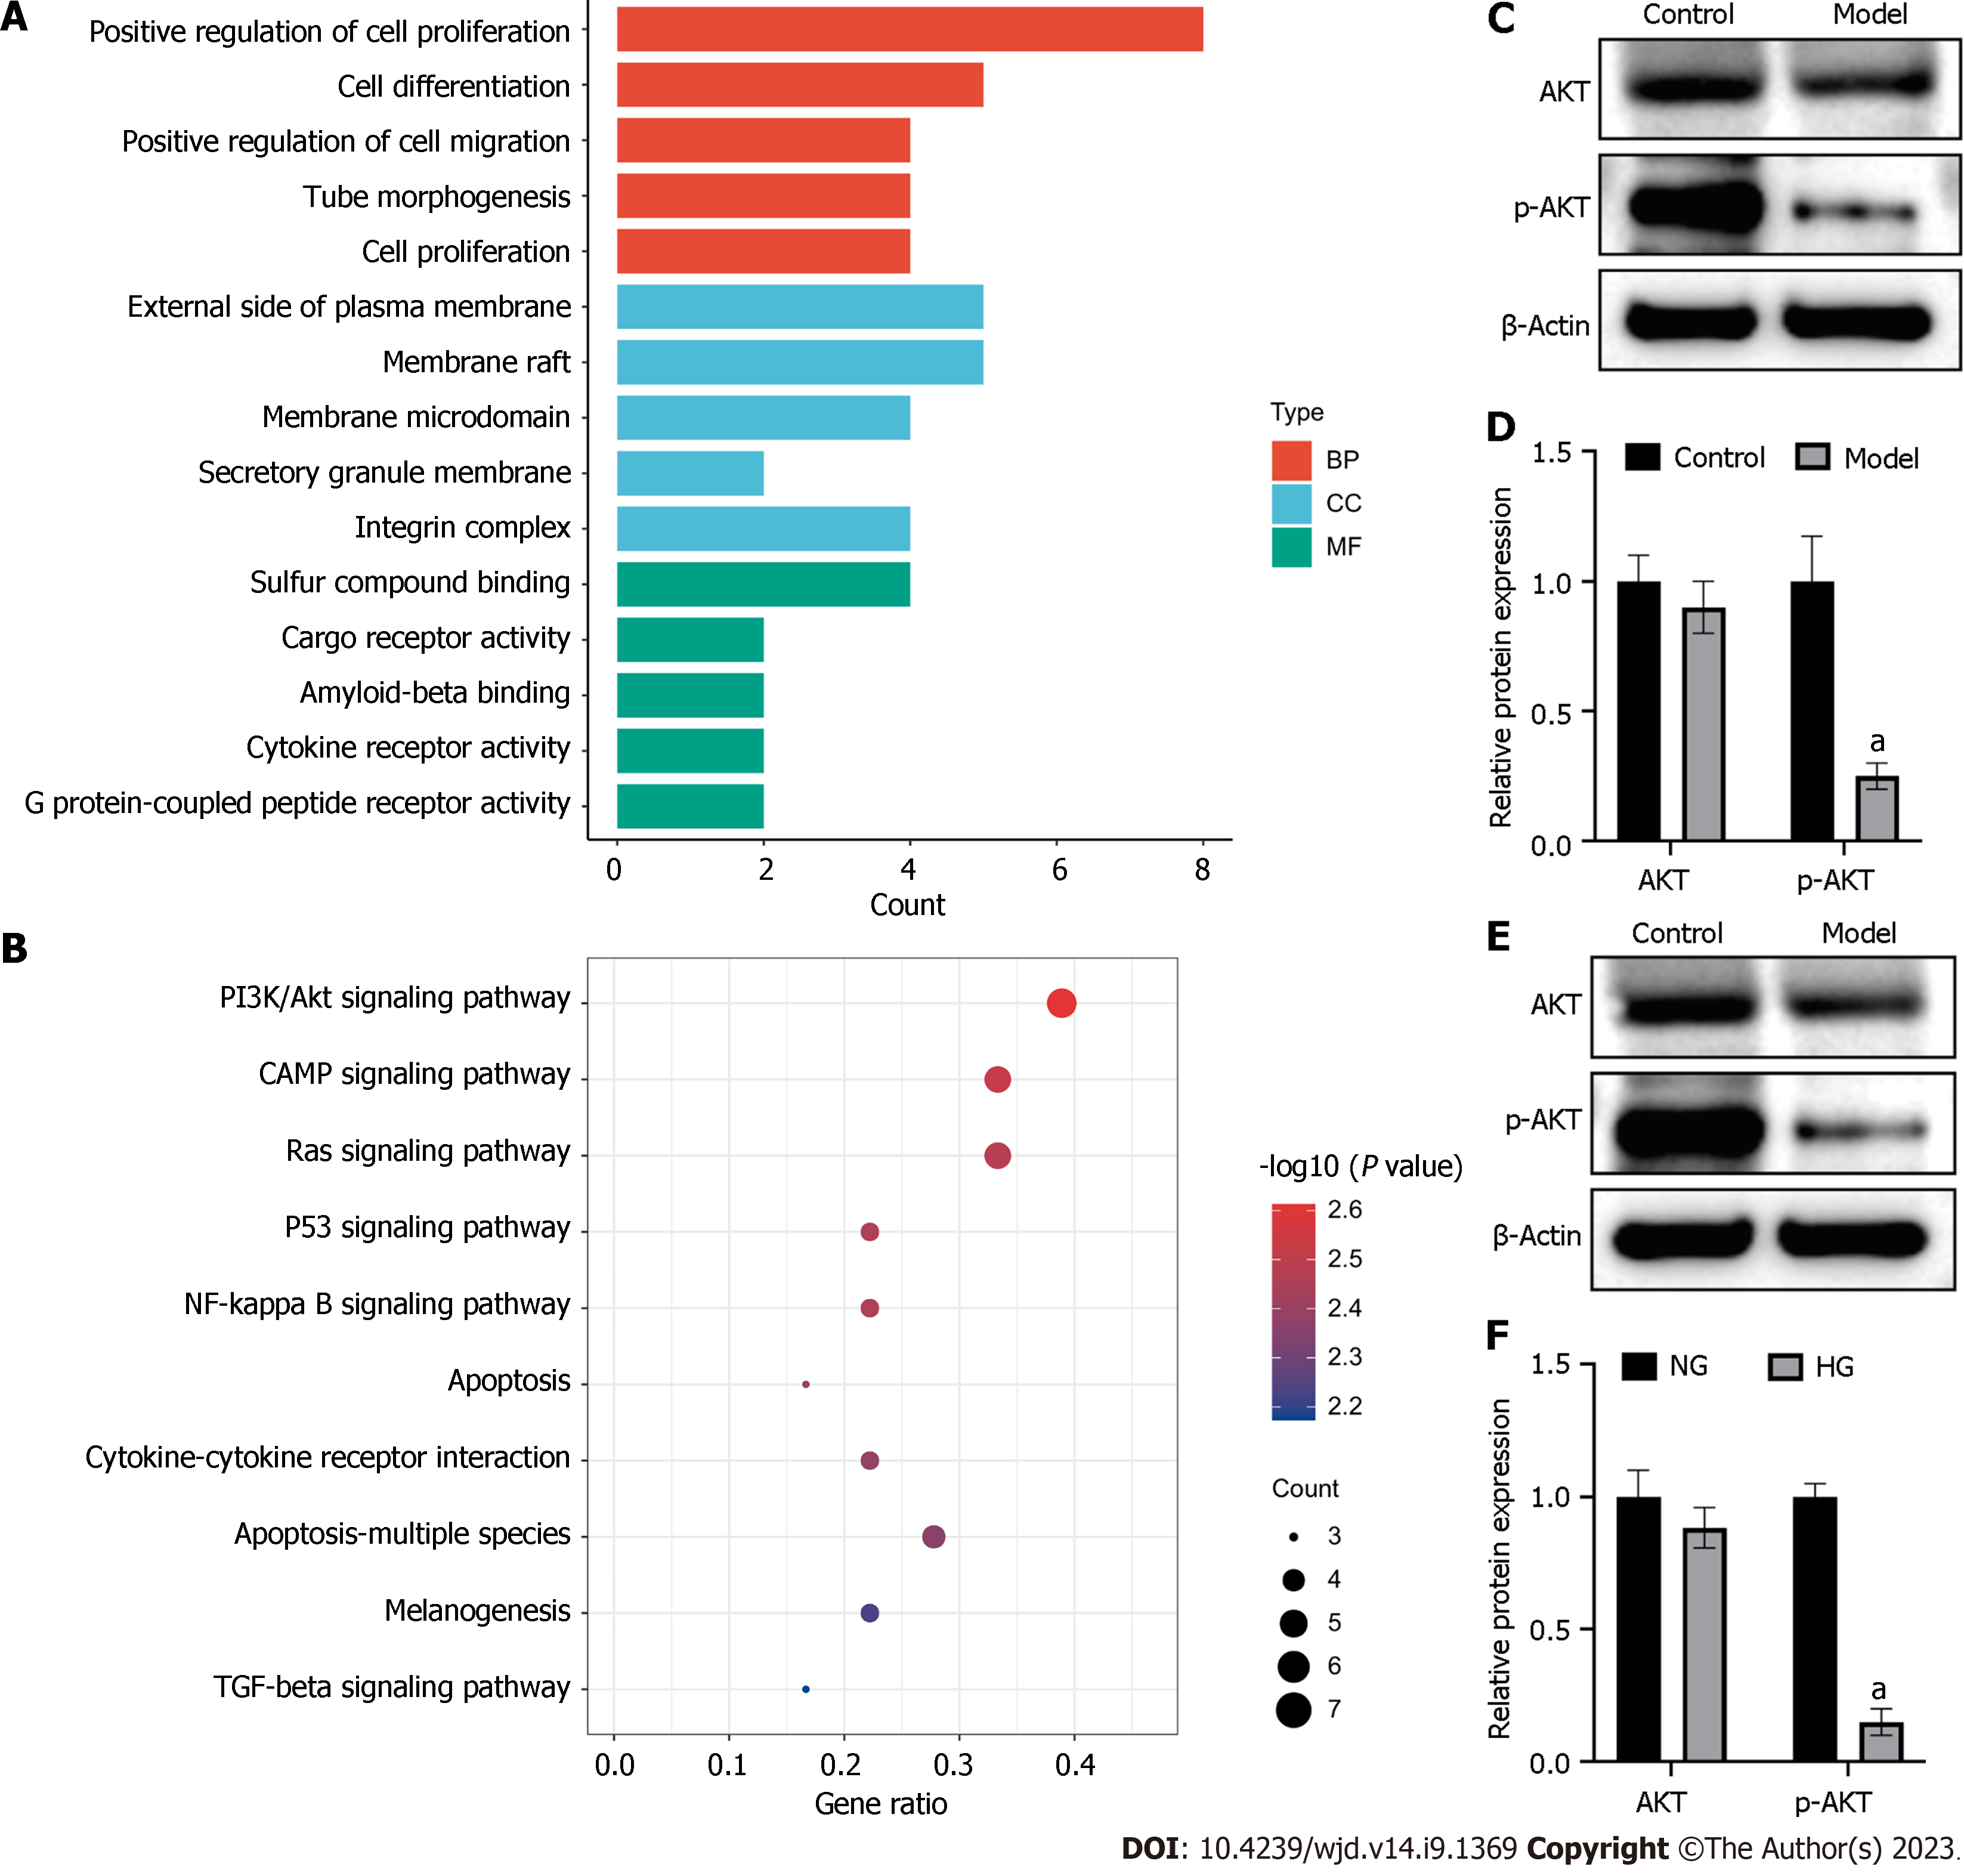
Figure 7 High glucose inhibited PI3K/Akt signalling pathway in vivo and in vitro.
A: Barplot of Gene Ontology enrichment analysis; B: Dotplot of Kyoto Encyclopedia of Genes and Genomes pathway analysis; C: Western blot analysis of AKT and p-AKT expression in mice; D: Quantification of Western blot results; E: Western blot analysis of AKT and p-AKT expression in human umbilical vein endothelial cells (HUVECs); F: Quantification of Western blot results. aP < 0.01, compared to the control or NG group.
- Citation: Zhu XL, Hu DY, Zeng ZX, Jiang WW, Chen TY, Chen TC, Liao WQ, Lei WZ, Fang WJ, Pan WH. XB130 inhibits healing of diabetic skin ulcers through the PI3K/Akt signalling pathway. World J Diabetes 2023; 14(9): 1369-1384
- URL: https://www.wjgnet.com/1948-9358/full/v14/i9/1369.htm
- DOI: https://dx.doi.org/10.4239/wjd.v14.i9.1369


