Copyright
©The Author(s) 2023.
World J Diabetes. Jul 15, 2023; 14(7): 1077-1090
Published online Jul 15, 2023. doi: 10.4239/wjd.v14.i7.1077
Published online Jul 15, 2023. doi: 10.4239/wjd.v14.i7.1077
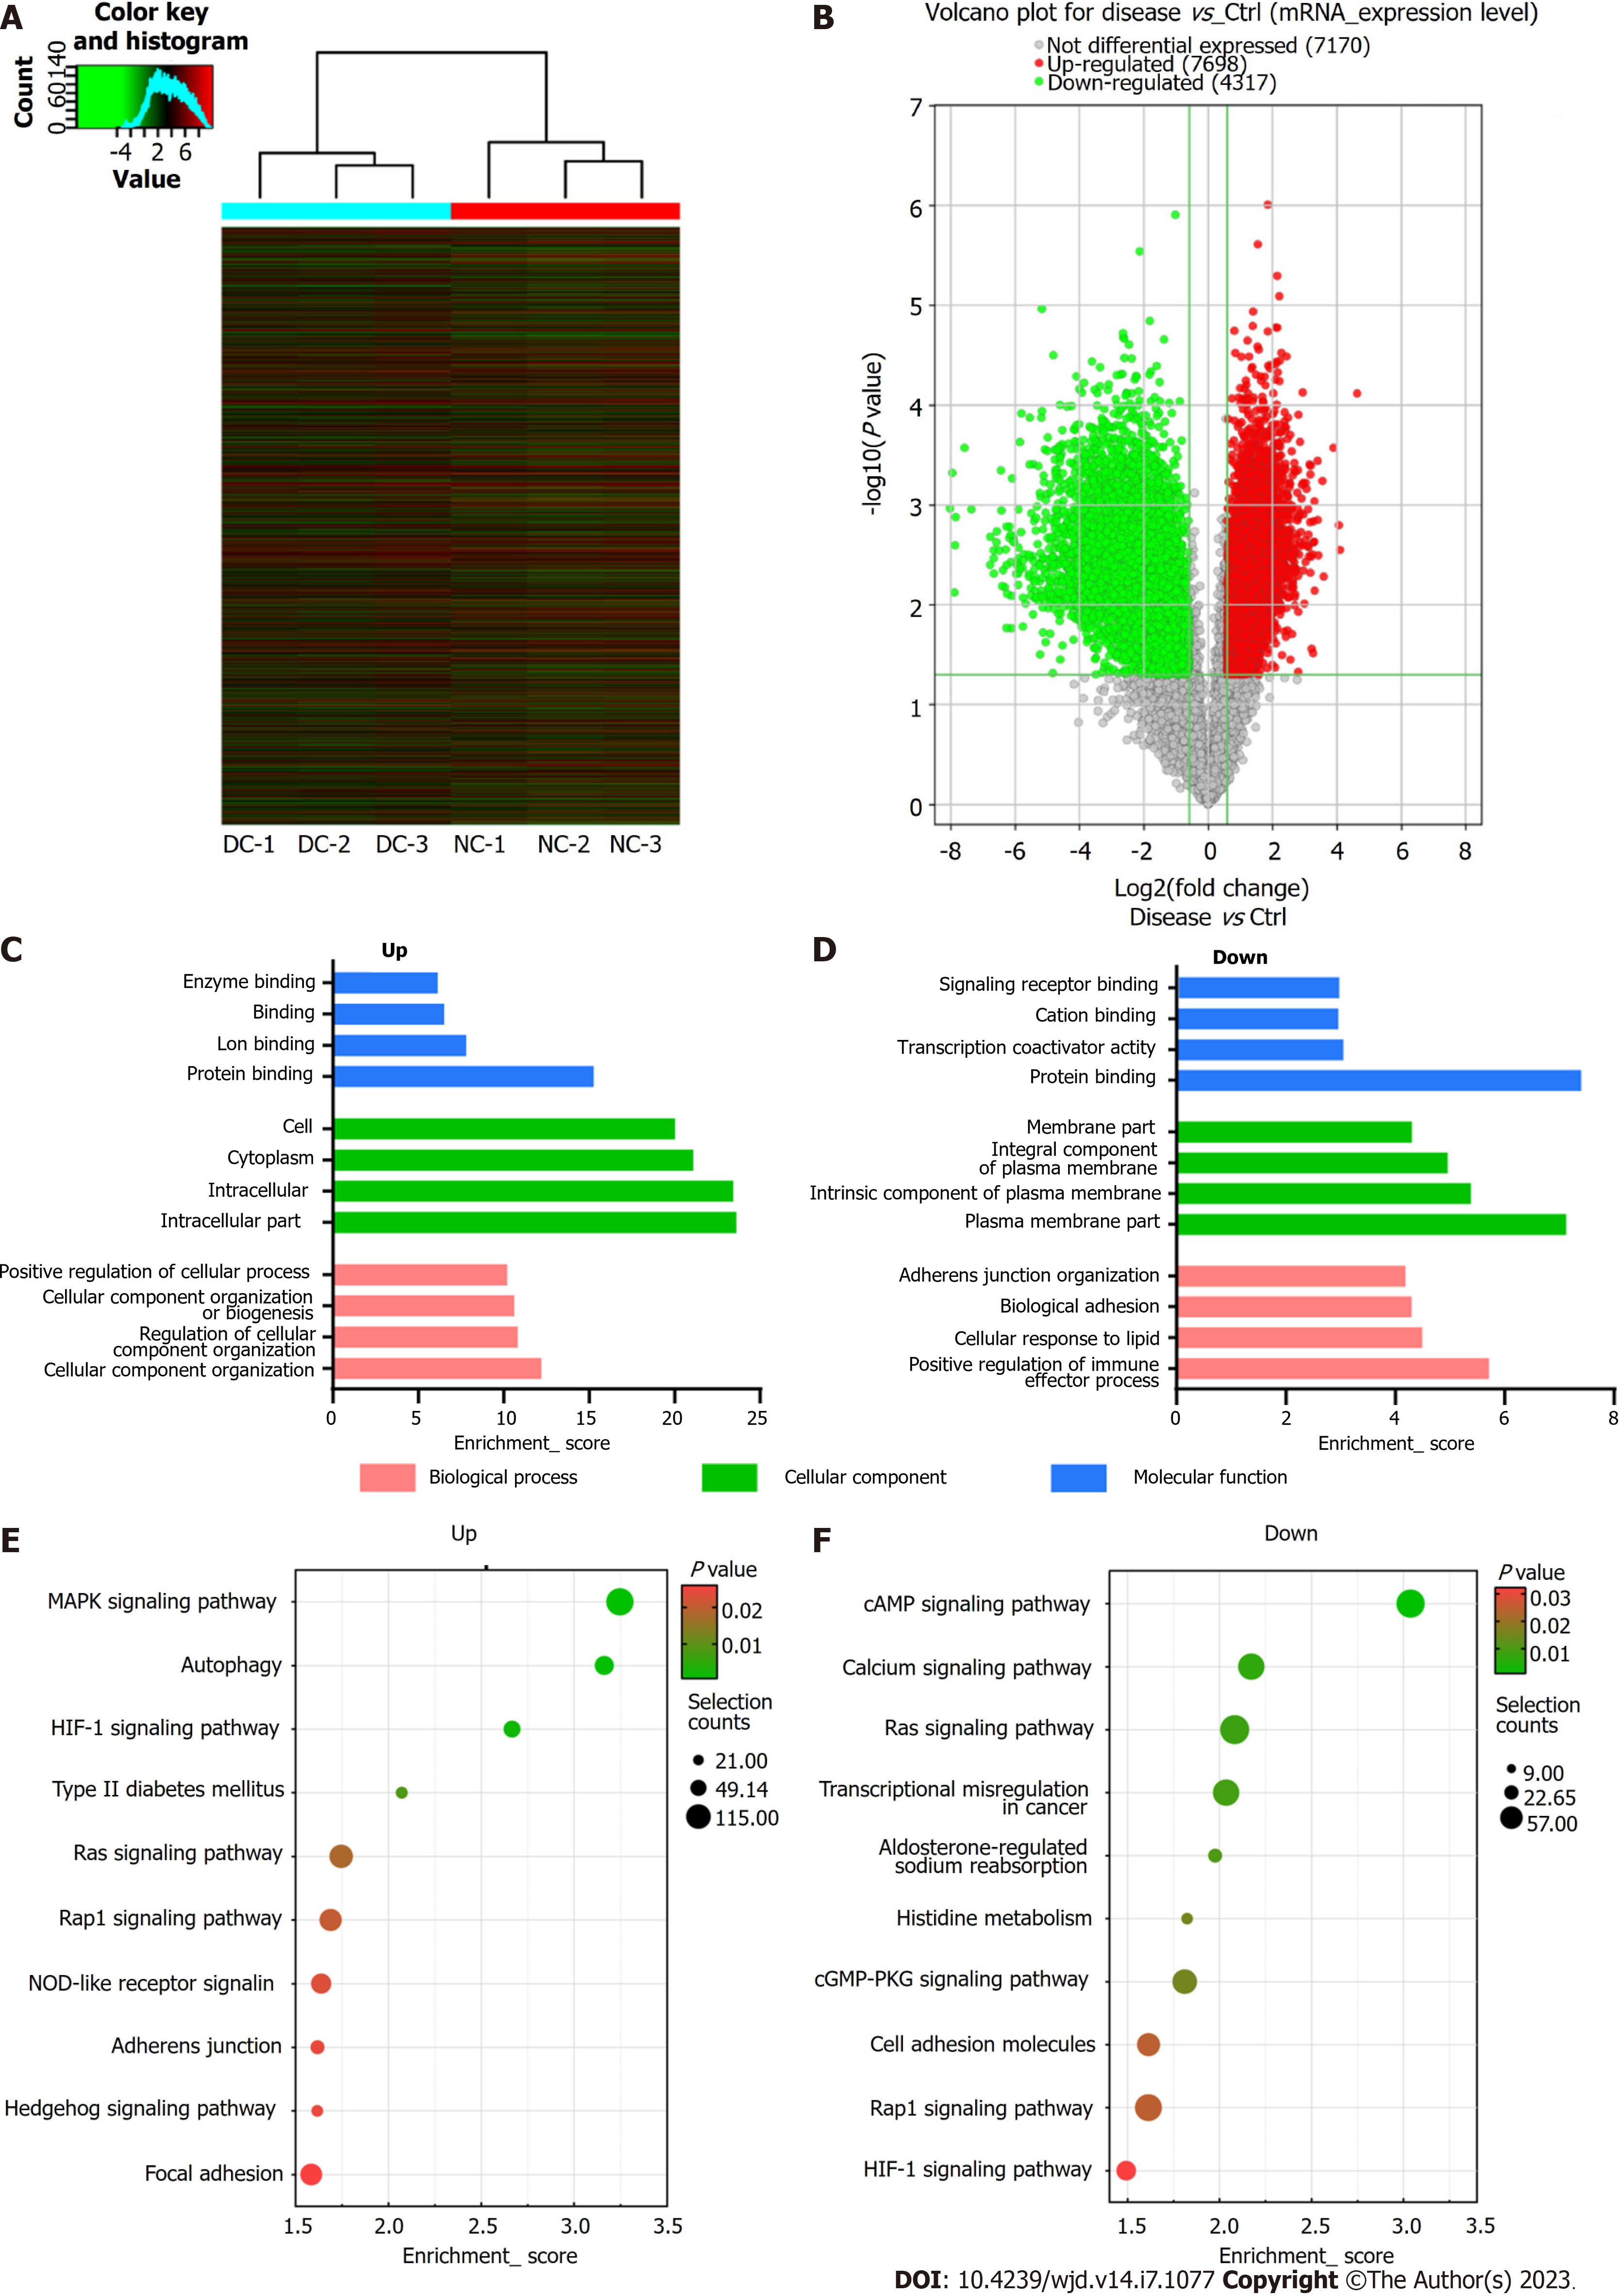
Figure 5 Microarray data showing the profiles of differentially expressed mRNAs.
A: Visualization of differentially expressed mRNAs (DEmRNAs) profiles between diabetic cataract (DC) cases and normal controls (NCs) through heat map and hierarchical clustering, where red and green colors indicate up- and down-regulated mRNAs, respectively; B: Volcano plot showing significant dysregulation of 12015 mRNAs in DC cases than in NCs; C and D: The top four most enriched Gene Ontology terms of down- (C) and up-regulated mRNAs (D); E and F: The top 10 Kyoto Encyclopedia of Genes and Genomes pathways of down (E) and up-regulated mRNAs (F).
- Citation: Cai L, Han XY, Li D, Ma DM, Shi YM, Lu Y, Yang J. Analysis of N6-methyladenosine-modified mRNAs in diabetic cataract. World J Diabetes 2023; 14(7): 1077-1090
- URL: https://www.wjgnet.com/1948-9358/full/v14/i7/1077.htm
- DOI: https://dx.doi.org/10.4239/wjd.v14.i7.1077


