Copyright
©The Author(s) 2023.
World J Diabetes. Jul 15, 2023; 14(7): 1077-1090
Published online Jul 15, 2023. doi: 10.4239/wjd.v14.i7.1077
Published online Jul 15, 2023. doi: 10.4239/wjd.v14.i7.1077
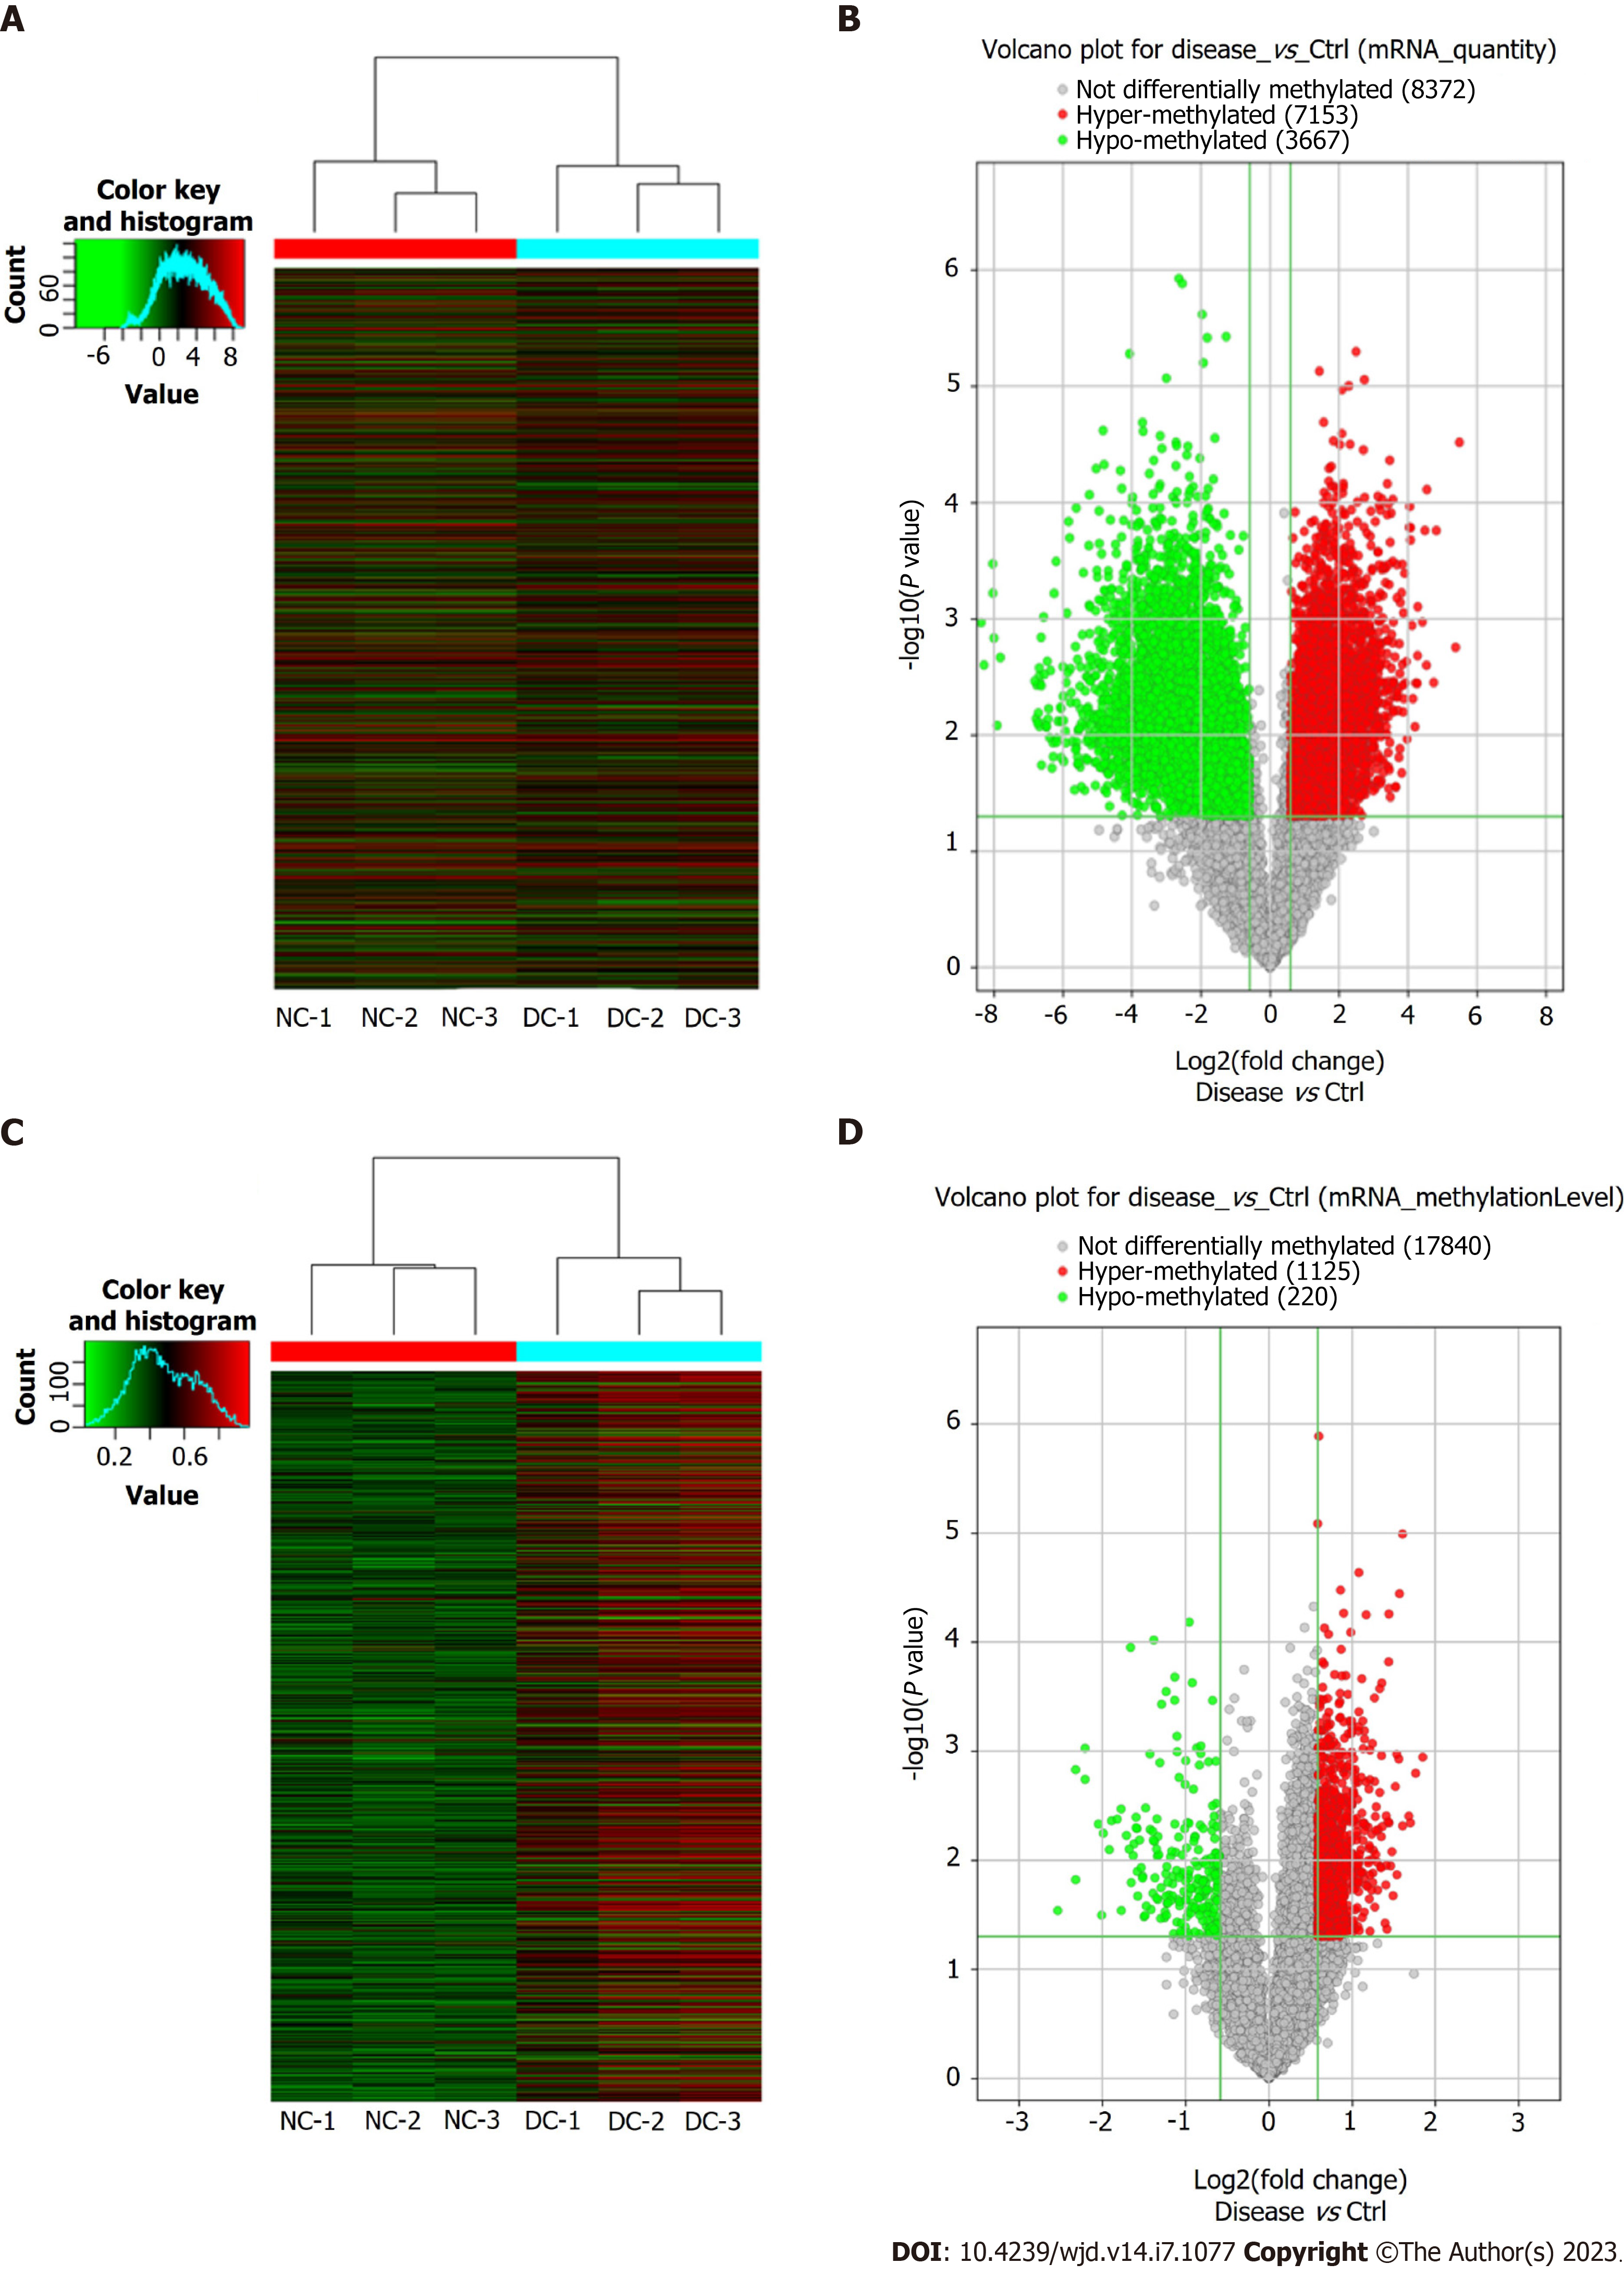
Figure 2 Microarray data analysis showing expression profile of methylated mRNAs.
A: Visualization of differential N6-methyladenosine (m6A) quantity profiles of mRNAs between the diabetic cataract (DC) and normal control (NC) groups through heat map and hierarchical clustering, where red and green colors indicate up- and down-regulated mRNAs, respectively; B: Volcano plot showing significant dysregulation of 10820 (7153 upregulated and 3667 downregulated) mRNAs in DC cases compared to NCs; C: Visualization of differential m6A mRNA methylation level profiles between DC cases and NCs through heat map and hierarchical clustering, where red and green colors indicate up- and down-regulated mRNAs, respectively; D: Volcano plot showing significant dysregulation of 1345 (1125 upregulated and 220 downregulated) methylated mRNAs in DC cases versus NCs.
- Citation: Cai L, Han XY, Li D, Ma DM, Shi YM, Lu Y, Yang J. Analysis of N6-methyladenosine-modified mRNAs in diabetic cataract. World J Diabetes 2023; 14(7): 1077-1090
- URL: https://www.wjgnet.com/1948-9358/full/v14/i7/1077.htm
- DOI: https://dx.doi.org/10.4239/wjd.v14.i7.1077


