Copyright
©The Author(s) 2023.
World J Diabetes. Jul 15, 2023; 14(7): 1057-1076
Published online Jul 15, 2023. doi: 10.4239/wjd.v14.i7.1057
Published online Jul 15, 2023. doi: 10.4239/wjd.v14.i7.1057
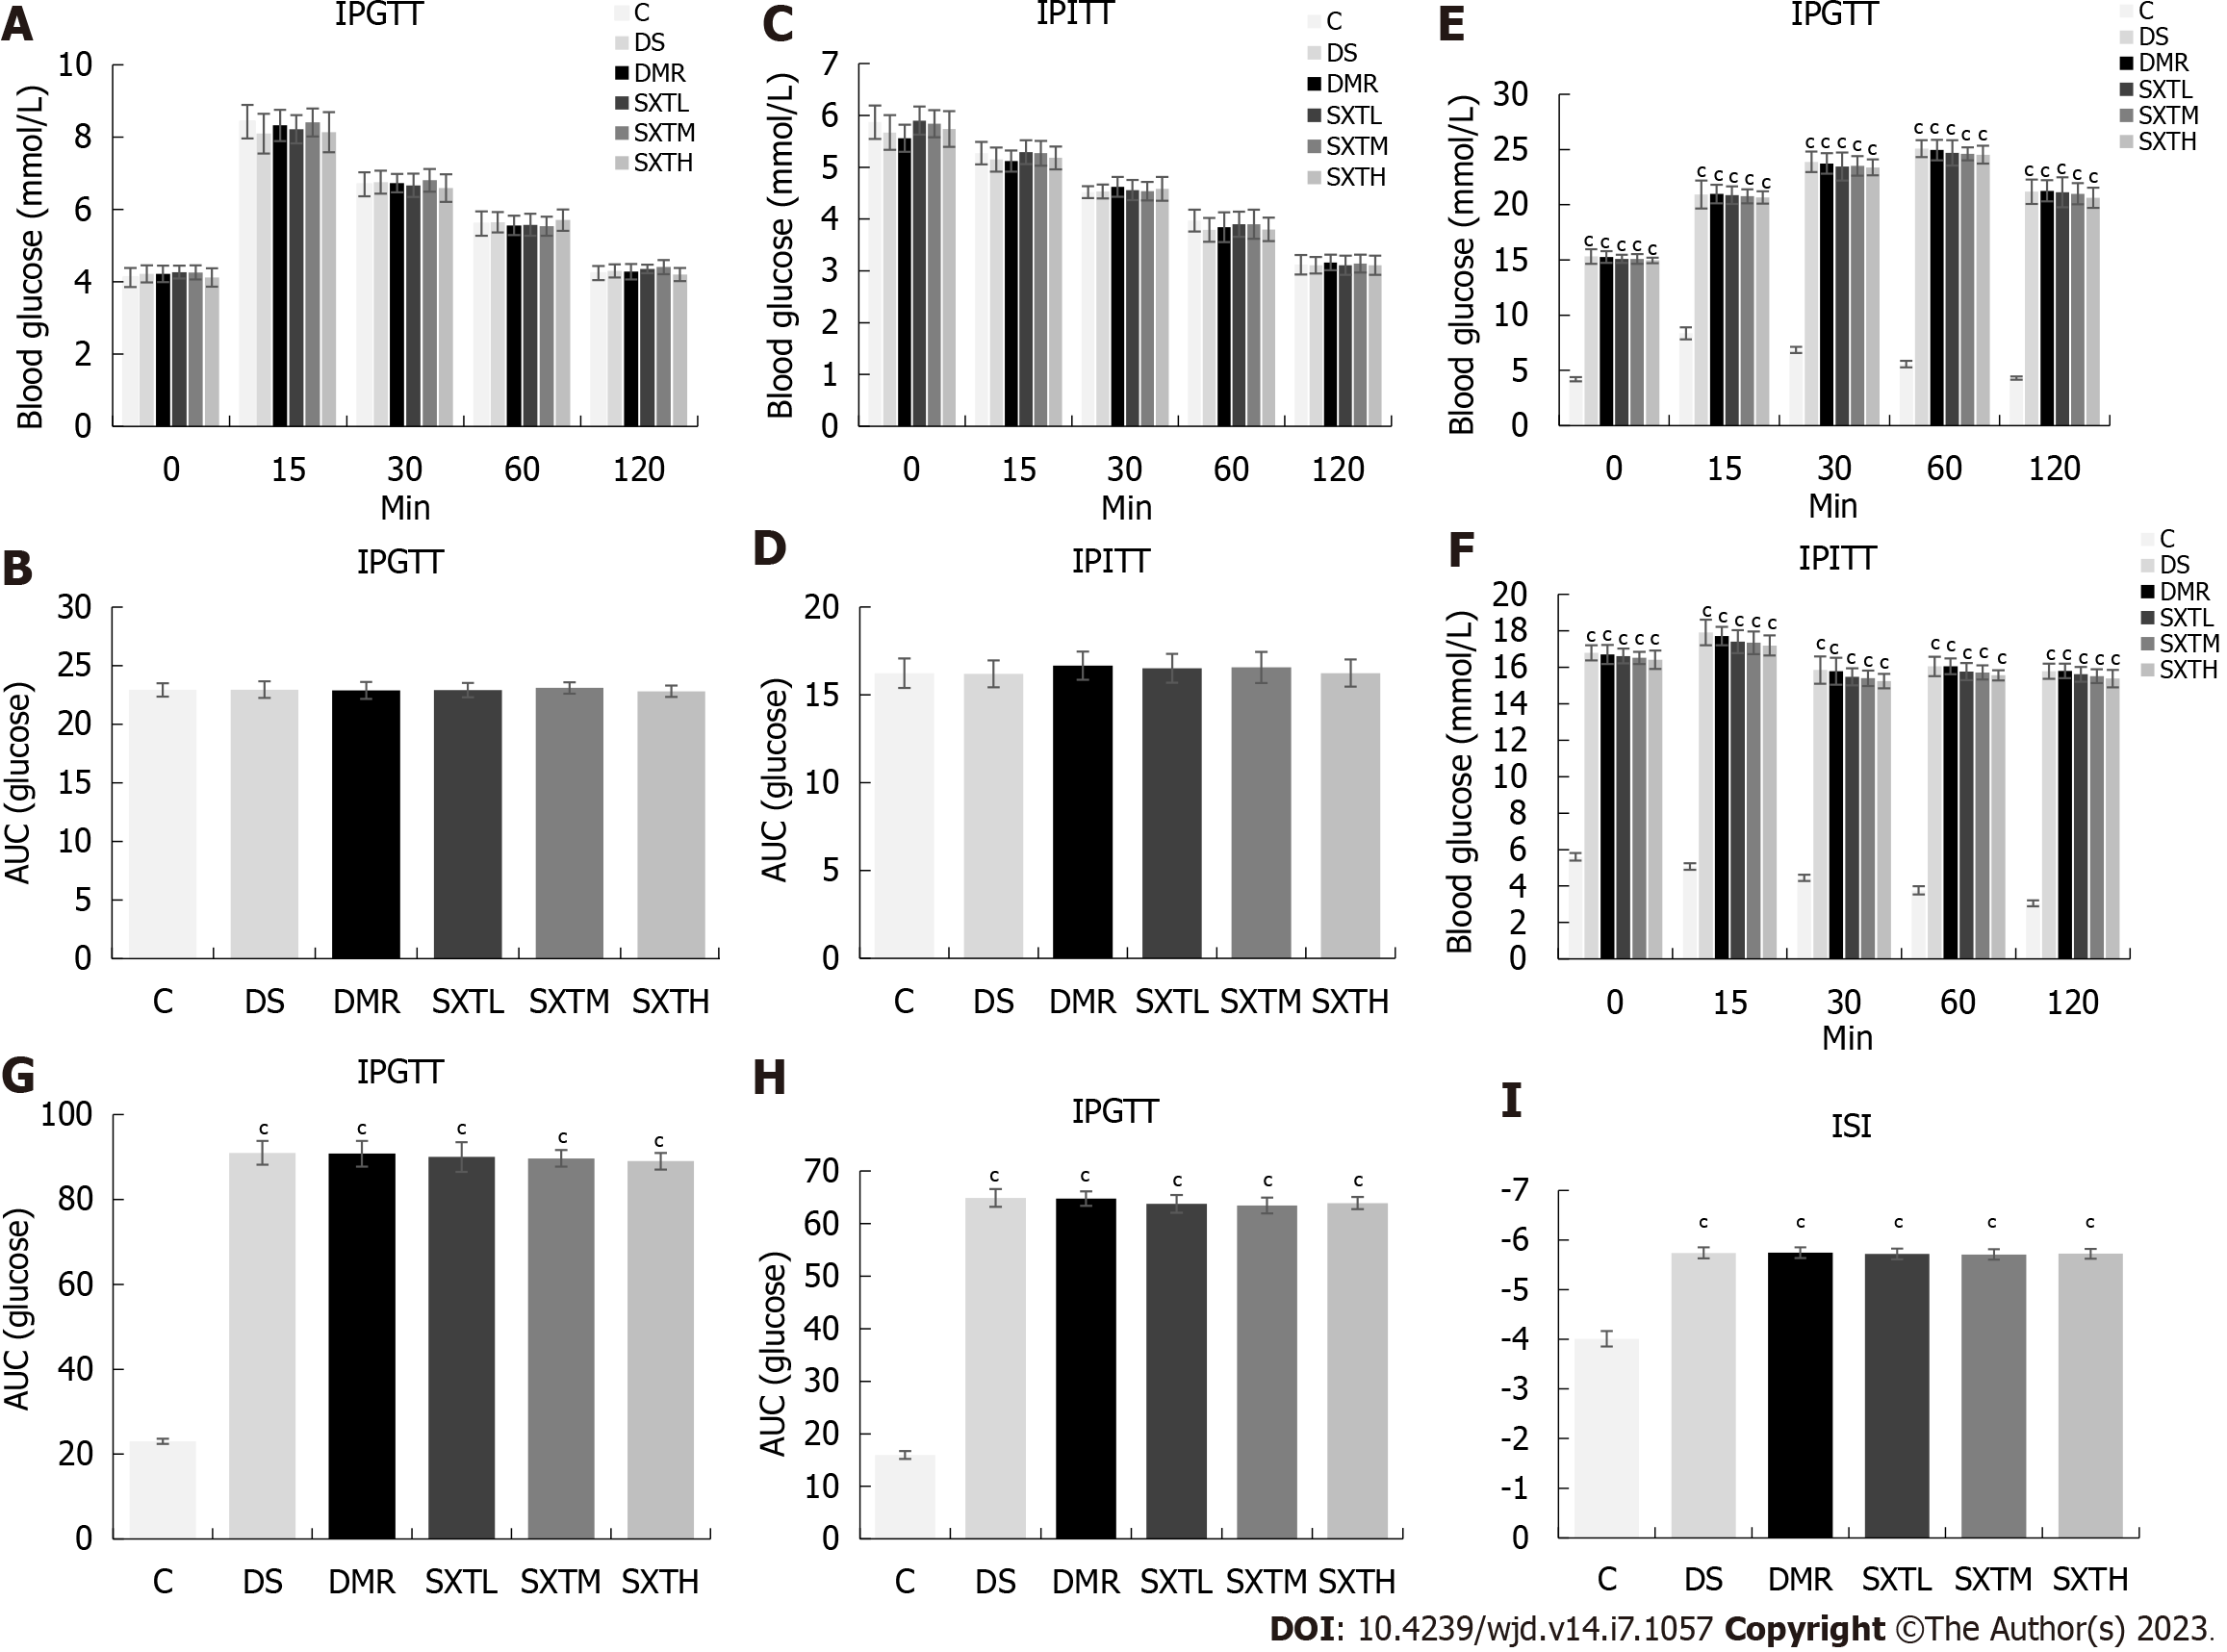
Figure 8 Intraperitoneal glucose tolerance test, intraperitoneal insulin tolerance test, and international sensitivity index of rats.
A: Intraperitoneal glucose tolerance test (IPGTT) at baseline; B: Average area under the curve (AUC) of IPGTT at baseline; C: Intraperitoneal insulin tolerance test (IPITT) at baseline; D: Average AUC of IPITT at baseline; E: IPGTT at the end of the experiment; F: IPITT at the end of the experiment; G: Average AUC of IPGTT at the end of the experiment; H: Average AUC of IPITT at the end of the experiment; I: International sensitivity index (ISI) at the end of the experiment. ISI = 1(/Log FPG × Log FINS). cP < 0.001 vs group C (n = 8-10 rats per group). IPGTT: Intraperitoneal glucose tolerance test; IPITT: Intraperitoneal insulin tolerance test; C: Normal control group; DS: Diabetic rats with sham operation group; MI/RI: Myocardial ischemia/reperfusion injury; DMR: MI/RI in diabetes group; SXTL: MI/RI in diabetic rats receiving SXT 0.7 g/kg/d group; SXTM: MI/RI in diabetic rats receiving SXT 1.4 g/kg/d group; SXTH: MI/RI in diabetic rats receiving SXT 2.8 g/kg/d group; AUC: Area under the curve.
- Citation: Yang L, Jian Y, Zhang ZY, Qi BW, Li YB, Long P, Yang Y, Wang X, Huang S, Huang J, Zhou LF, Ma J, Jiang CQ, Hu YH, Xiao WJ. Network-pharmacology-based research on protective effects and underlying mechanism of Shuxin decoction against myocardial ischemia/reperfusion injury with diabetes. World J Diabetes 2023; 14(7): 1057-1076
- URL: https://www.wjgnet.com/1948-9358/full/v14/i7/1057.htm
- DOI: https://dx.doi.org/10.4239/wjd.v14.i7.1057


