Copyright
©The Author(s) 2023.
World J Diabetes. Jun 15, 2023; 14(6): 862-882
Published online Jun 15, 2023. doi: 10.4239/wjd.v14.i6.862
Published online Jun 15, 2023. doi: 10.4239/wjd.v14.i6.862
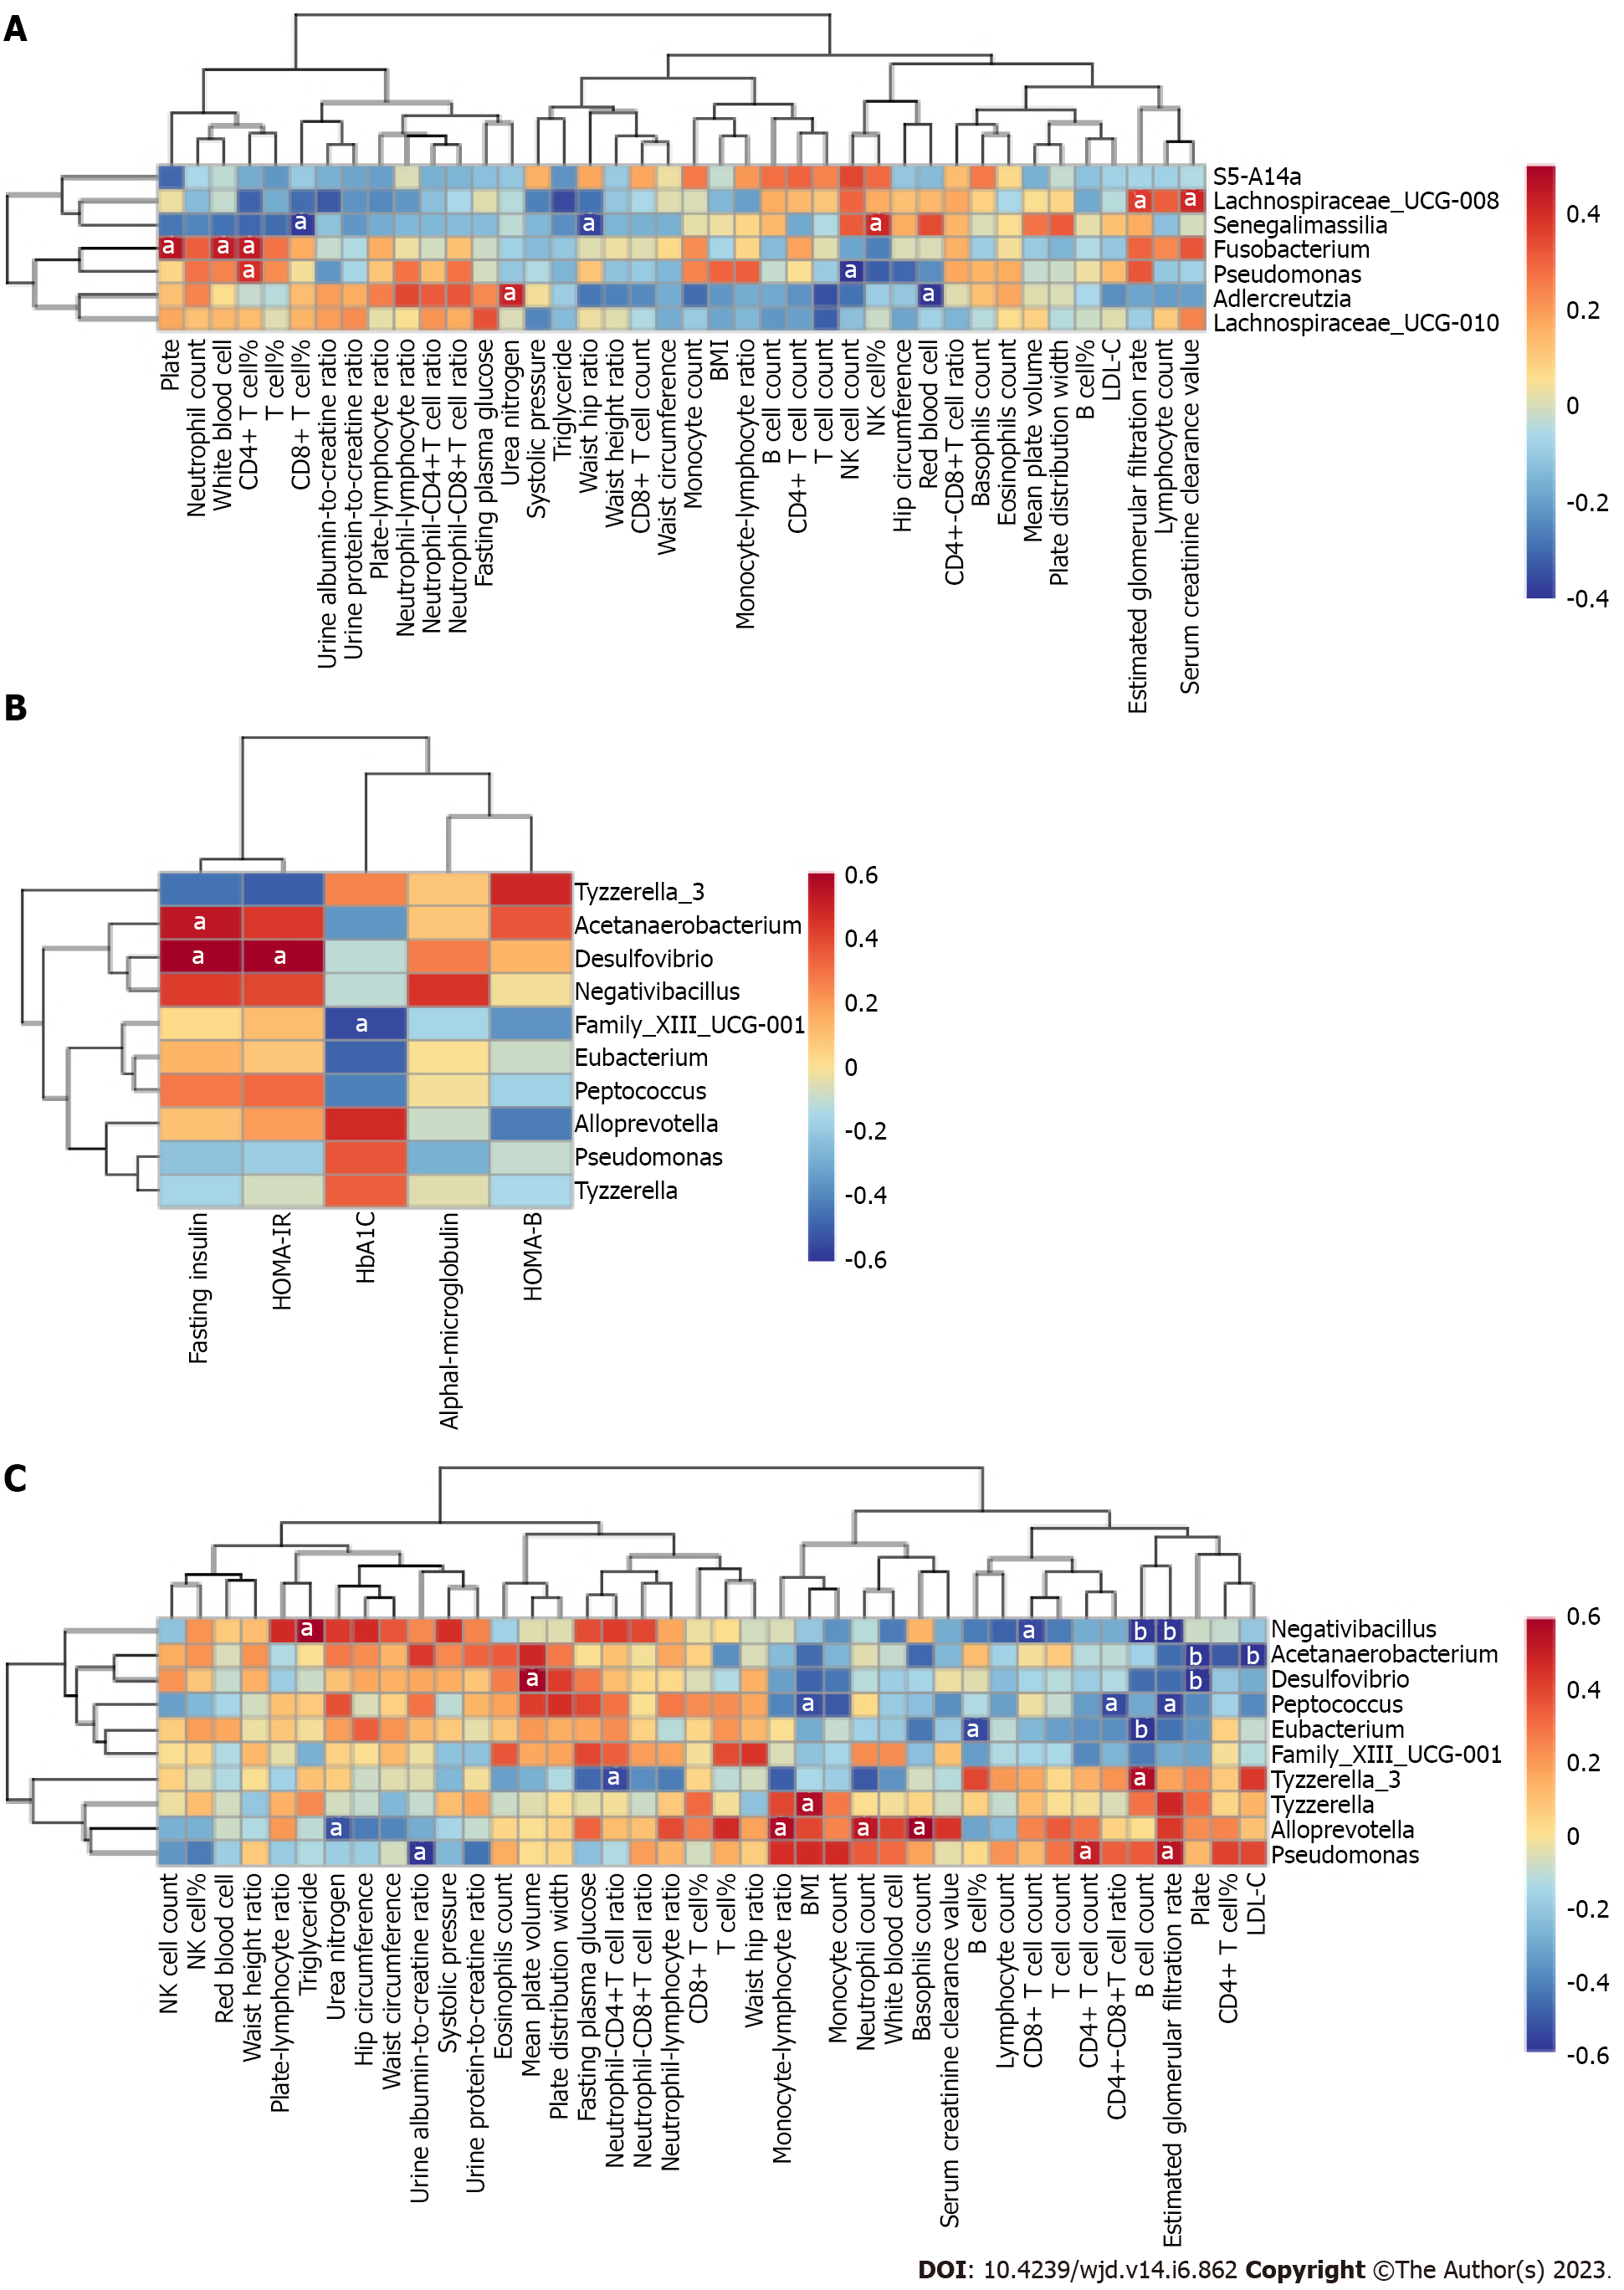
Figure 7 Correlation heatmap between gut microbiota and clinical indices.
A: Correlation heatmap between gut microbiota and clinical indices in Group DM (Group DR vs Group D); B and C: Correlation heatmap between gut microbiota and clinical indices in Group DR (Group PDR vs Group NPDR). Different colors represent correlation level. Different colors represent correlation level (blue represents for negative correlation, red represents for positive correlation). aP < 0.05; bP < 0.01. Group C: Samples with non-diabetics; Group DM: Samples with diabetics; Group DR: Samples with diabetic retinopathy; Group D: Samples without diabetic retinopathy; Group PDR: Patients with proliferative diabetic retinopathy; Group NPDR: Patients without proliferative diabetic retinopathy.
- Citation: Gu XM, Lu CY, Pan J, Ye JZ, Zhu QH. Alteration of intestinal microbiota is associated with diabetic retinopathy and its severity: Samples collected from southeast coast Chinese. World J Diabetes 2023; 14(6): 862-882
- URL: https://www.wjgnet.com/1948-9358/full/v14/i6/862.htm
- DOI: https://dx.doi.org/10.4239/wjd.v14.i6.862


