Copyright
©The Author(s) 2023.
World J Diabetes. Jun 15, 2023; 14(6): 862-882
Published online Jun 15, 2023. doi: 10.4239/wjd.v14.i6.862
Published online Jun 15, 2023. doi: 10.4239/wjd.v14.i6.862
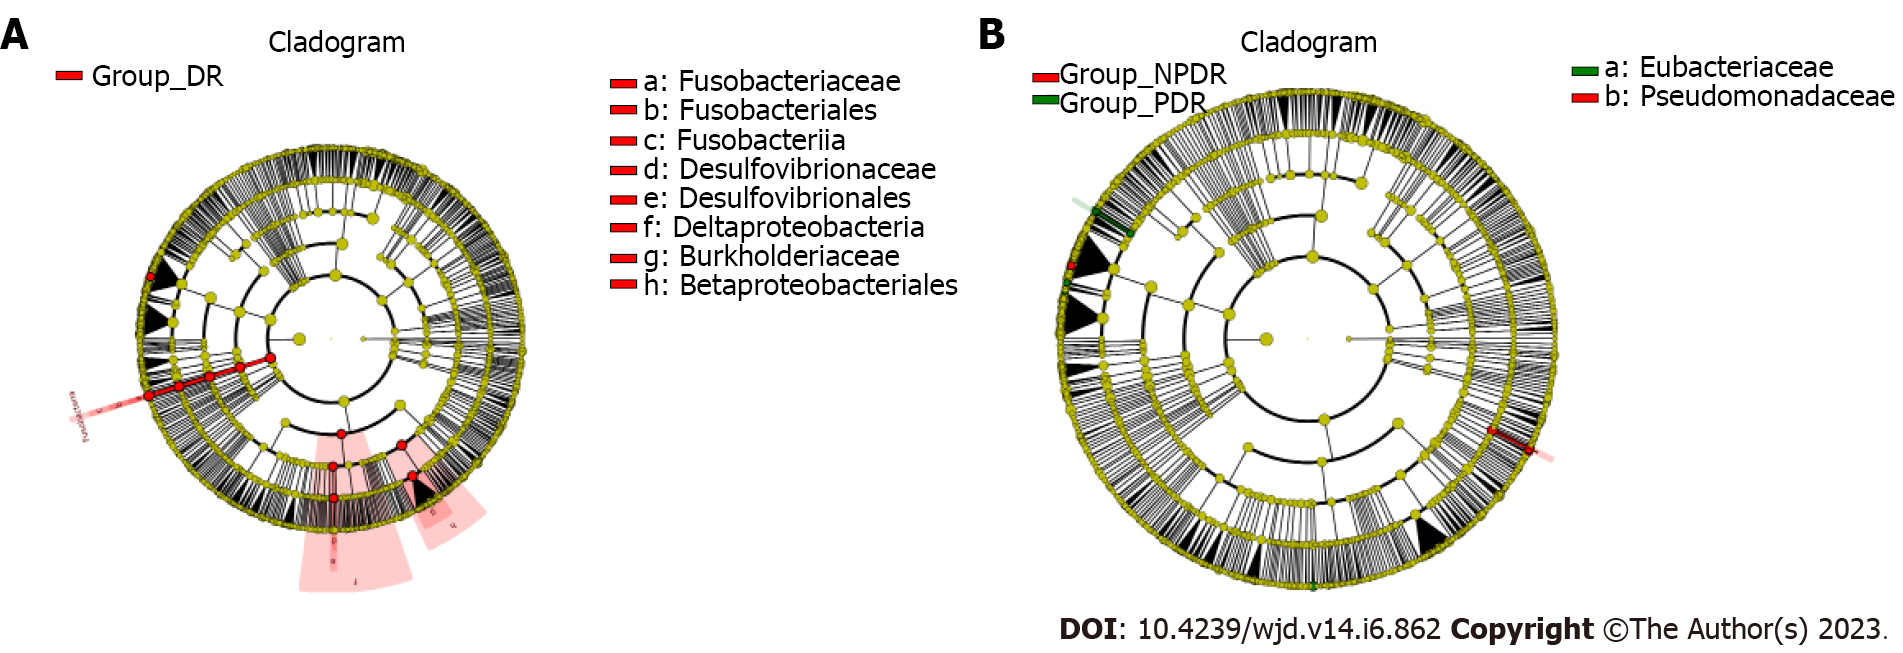
Figure 5 Results of linear discriminant analysis effect size in the six groups.
Wilcoxon signed rank test was used for statistical analyzing. The threshold of linear discriminant analysis score was set to 2.0. A and B: Red nodes designated microorganism that only been detected in Group DR. The regions marked with yellow indicated no significant difference between Group DR and Group D as well as Group PDR and NPDR. Group DR: Samples with diabetic retinopathy; Group D: Samples without diabetic retinopathy; Group PDR: Patients with proliferative diabetic retinopathy; Group NPDR: Patients without proliferative diabetic retinopathy.
- Citation: Gu XM, Lu CY, Pan J, Ye JZ, Zhu QH. Alteration of intestinal microbiota is associated with diabetic retinopathy and its severity: Samples collected from southeast coast Chinese. World J Diabetes 2023; 14(6): 862-882
- URL: https://www.wjgnet.com/1948-9358/full/v14/i6/862.htm
- DOI: https://dx.doi.org/10.4239/wjd.v14.i6.862


