Copyright
©The Author(s) 2023.
World J Diabetes. Jun 15, 2023; 14(6): 862-882
Published online Jun 15, 2023. doi: 10.4239/wjd.v14.i6.862
Published online Jun 15, 2023. doi: 10.4239/wjd.v14.i6.862
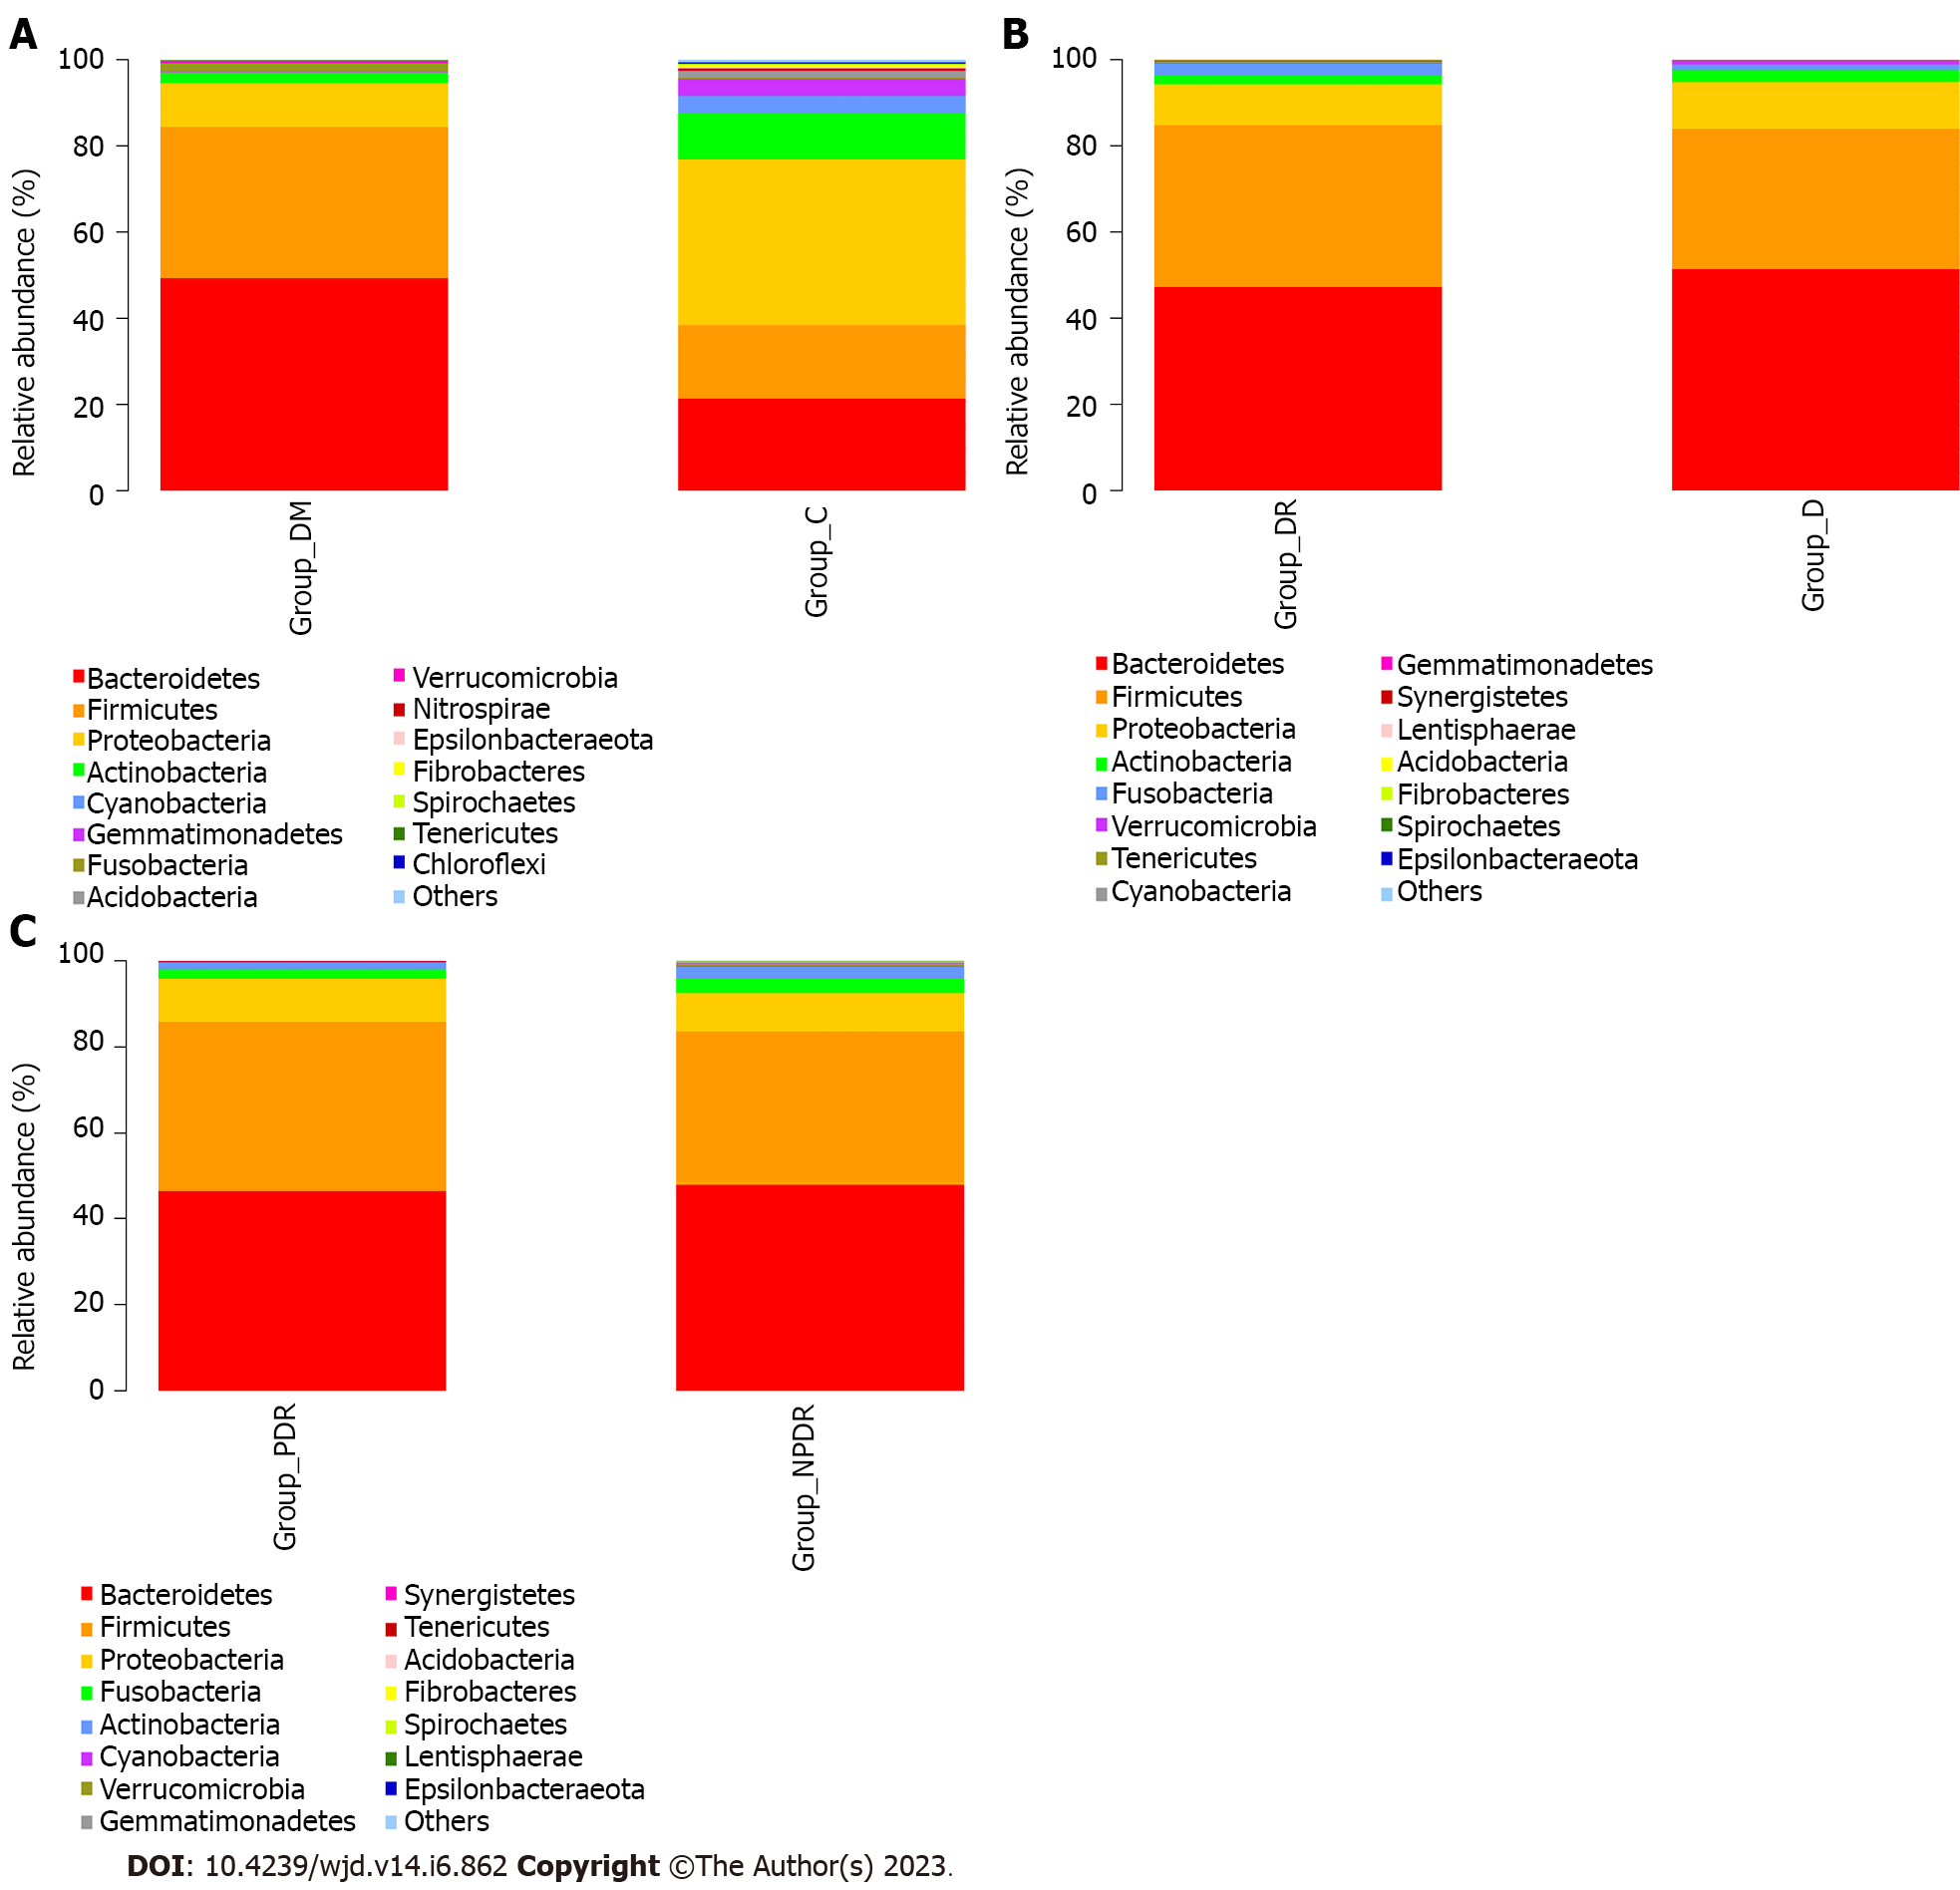
Figure 4 The composition at phylum level in the six groups.
A: The composition at phylum level in Group DM and Group C. The abundance of Firmicutes, Bacteroidetes, Proteobacteria and Actinobacteria varied between the two groups; B: The composition at phylum level in Group DR and Group D. The relative mean abundance of phylum Bacteroidetes and Firmicutes between Group D and Group DR were similar (P = 0.33, P = 0.37); C: The composition at phylum level in Group PDR and Group NPDR. The relative mean abundance of phylum Bacteroidetes, Firmicutes and showed a similarity between Group PDR and NPDR (P = 0.71, P = 0.33). Group C: Samples with non-diabetics; Group DM: Samples with diabetics; Group DR: Samples with diabetic retinopathy; Group D: Samples without diabetic retinopathy; Group PDR: Patients with proliferative diabetic retinopathy; Group NPDR: Patients without proliferative diabetic retinopathy.
- Citation: Gu XM, Lu CY, Pan J, Ye JZ, Zhu QH. Alteration of intestinal microbiota is associated with diabetic retinopathy and its severity: Samples collected from southeast coast Chinese. World J Diabetes 2023; 14(6): 862-882
- URL: https://www.wjgnet.com/1948-9358/full/v14/i6/862.htm
- DOI: https://dx.doi.org/10.4239/wjd.v14.i6.862


