Copyright
©The Author(s) 2023.
World J Diabetes. Mar 15, 2023; 14(3): 313-342
Published online Mar 15, 2023. doi: 10.4239/wjd.v14.i3.313
Published online Mar 15, 2023. doi: 10.4239/wjd.v14.i3.313
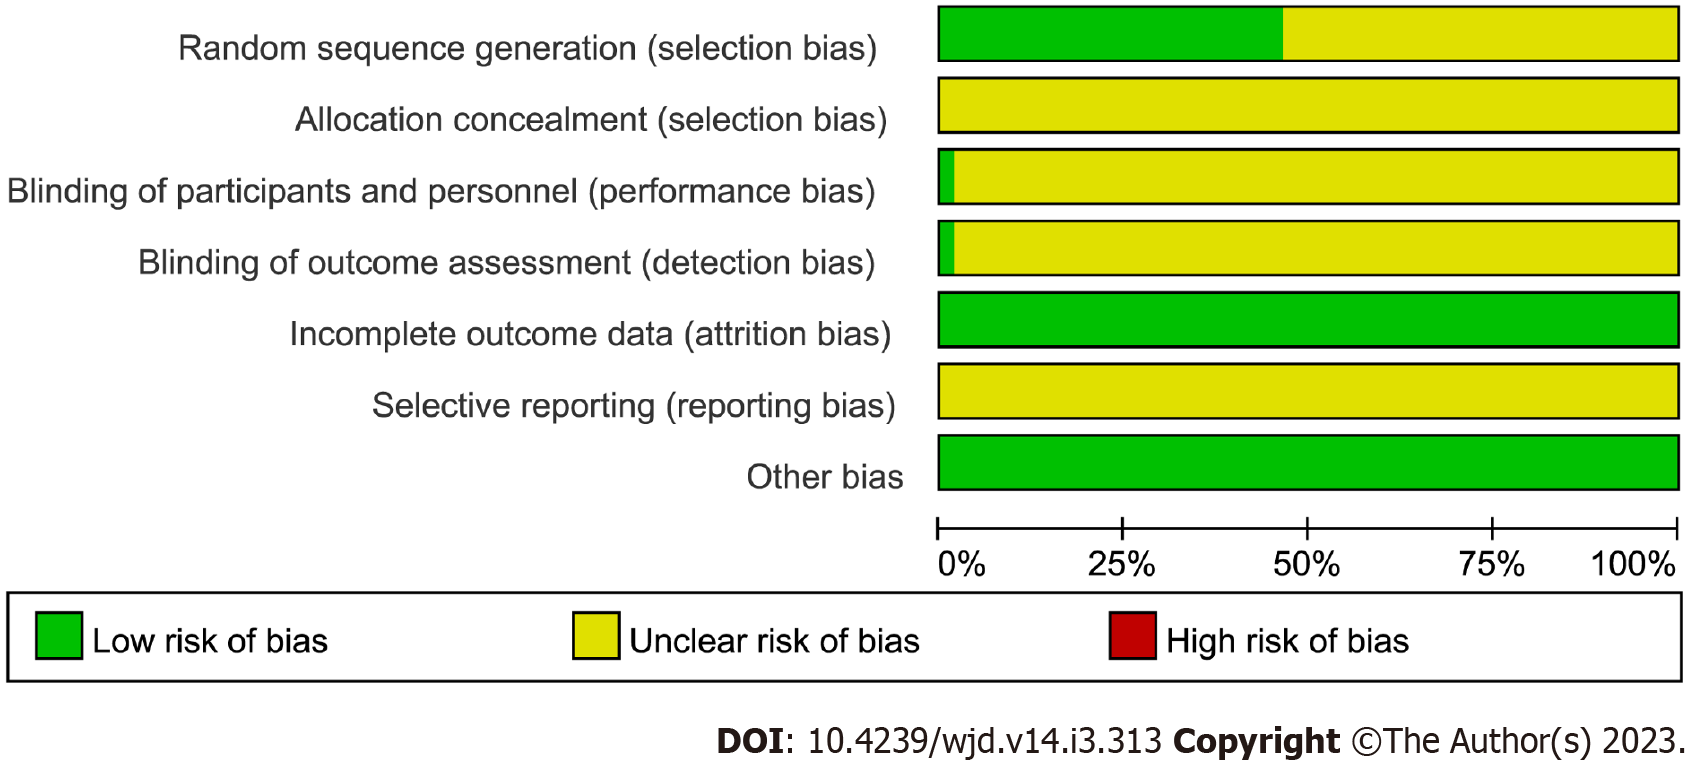
Figure 2 Graph showing the included randomized controlled trials' risk of bias.
The proportion of the total number of randomized controlled trials is represented on the horizontal axis, while the vertical axis displays the bias risk elements. The "unclear danger of bias" should be viewed as "low risk of bias" for the outcome whose evaluation procedure is objective.
- Citation: Zhang YX, Zhang YJ, Miao RY, Fang XY, Wei JH, Wei Y, Lin JR, Tian JX. Effectiveness and safety of traditional Chinese medicine decoction for diabetic gastroparesis: A network meta-analysis. World J Diabetes 2023; 14(3): 313-342
- URL: https://www.wjgnet.com/1948-9358/full/v14/i3/313.htm
- DOI: https://dx.doi.org/10.4239/wjd.v14.i3.313


