Copyright
©The Author(s) 2023.
World J Diabetes. Mar 15, 2023; 14(3): 299-312
Published online Mar 15, 2023. doi: 10.4239/wjd.v14.i3.299
Published online Mar 15, 2023. doi: 10.4239/wjd.v14.i3.299
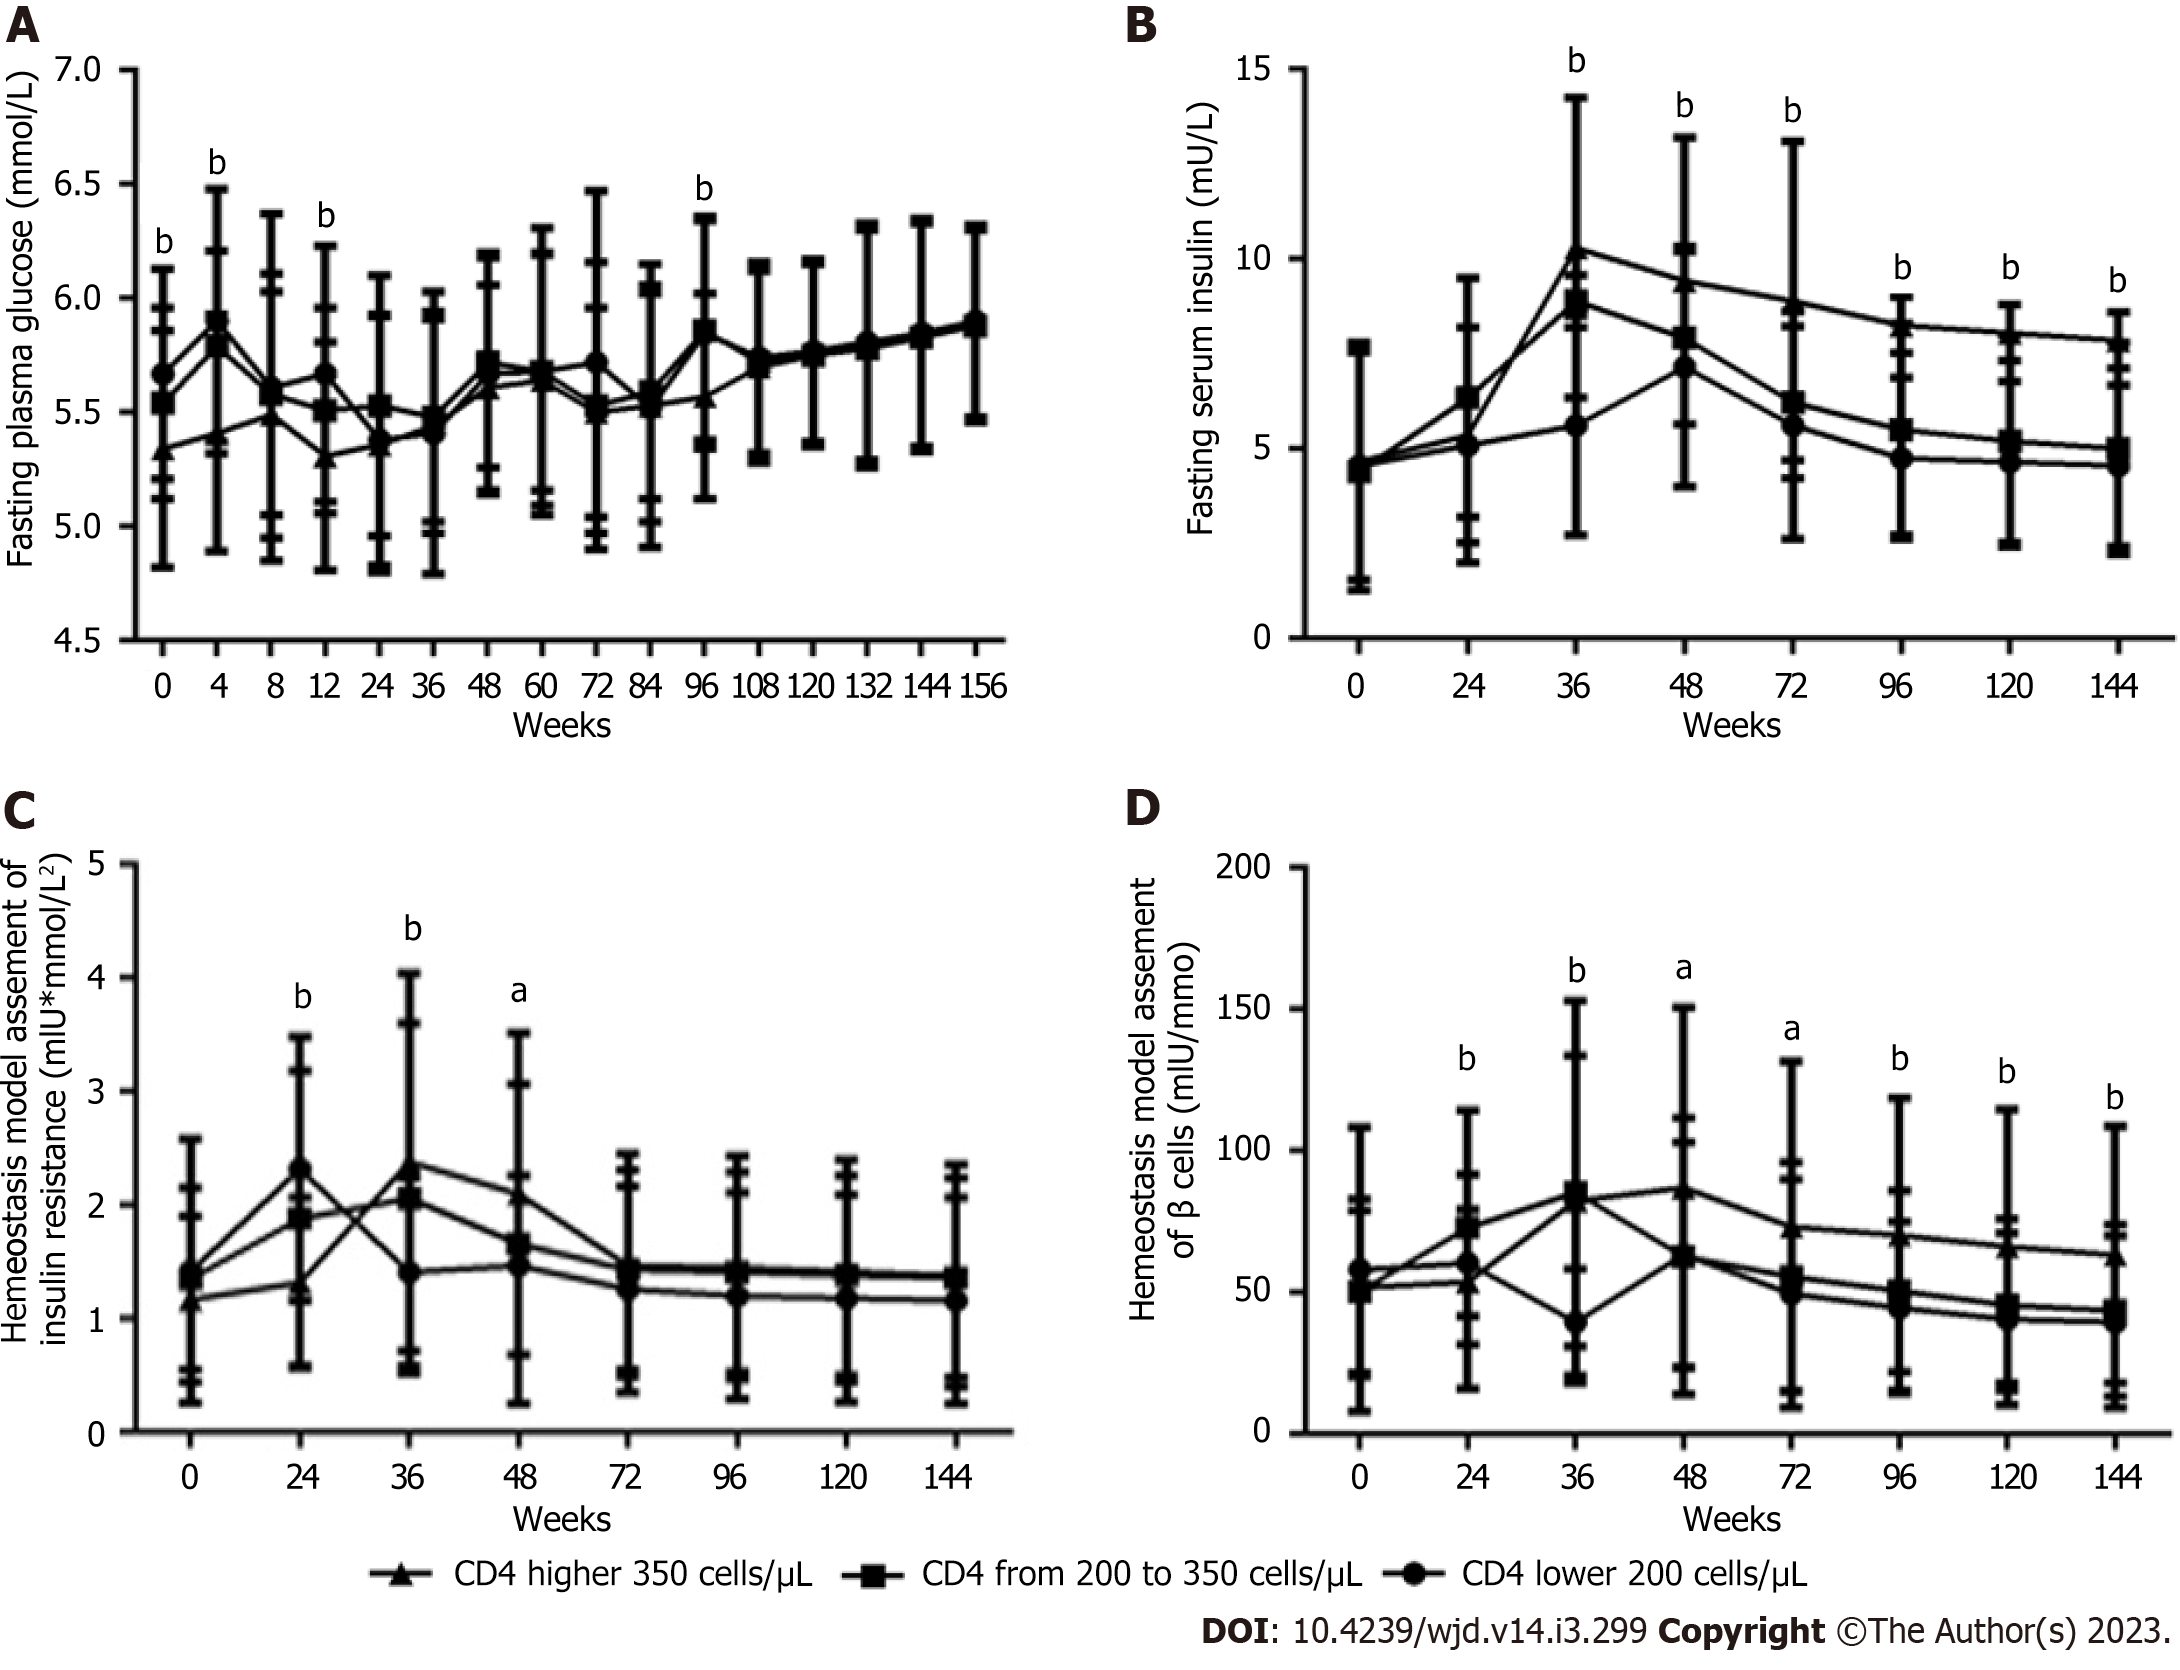
Figure 5 Long-term effects of baseline CD4+ T-cell count on glucose metabolism parameters within 156 wk after antiretroviral therapy with tenofovir plus lamivudine plus efavirenz in male patients living with human immunodeficiency virus (n = 61; 26, 12, and 23 patients in the < 200, 200 to 350, and > 350 groups, respectively).
A: Fasting plasma glucose level; B: Fasting serum insulin level; C: Homeostasis model assessment of insulin resistance value; D: Homeostasis model assessment of β-cell function value. Two-way ANOVA was used to compare glucose metabolism parameters among the three groups from baseline to 156 wk (interaction, A, P < 0.01; B, C, D, all P < 0.0001. Row factor, A, B, C, D, all P < 0.0001. Column factor, A, B, D, all P < 0.0001; B, P < 0.05). One-way ANOVA was used to compare glucose metabolism parameters among the three groups at the same time point, aP < 0.05, bP < 0.01.
- Citation: Liu DF, Zhang XY, Zhou RF, Cai L, Yan DM, Lan LJ, He SH, Tang H. Glucose metabolism continuous deteriorating in male patients with human immunodeficiency virus accepted antiretroviral therapy for 156 weeks. World J Diabetes 2023; 14(3): 299-312
- URL: https://www.wjgnet.com/1948-9358/full/v14/i3/299.htm
- DOI: https://dx.doi.org/10.4239/wjd.v14.i3.299


