Copyright
©The Author(s) 2023.
World J Diabetes. Dec 15, 2023; 14(12): 1839-1848
Published online Dec 15, 2023. doi: 10.4239/wjd.v14.i12.1839
Published online Dec 15, 2023. doi: 10.4239/wjd.v14.i12.1839
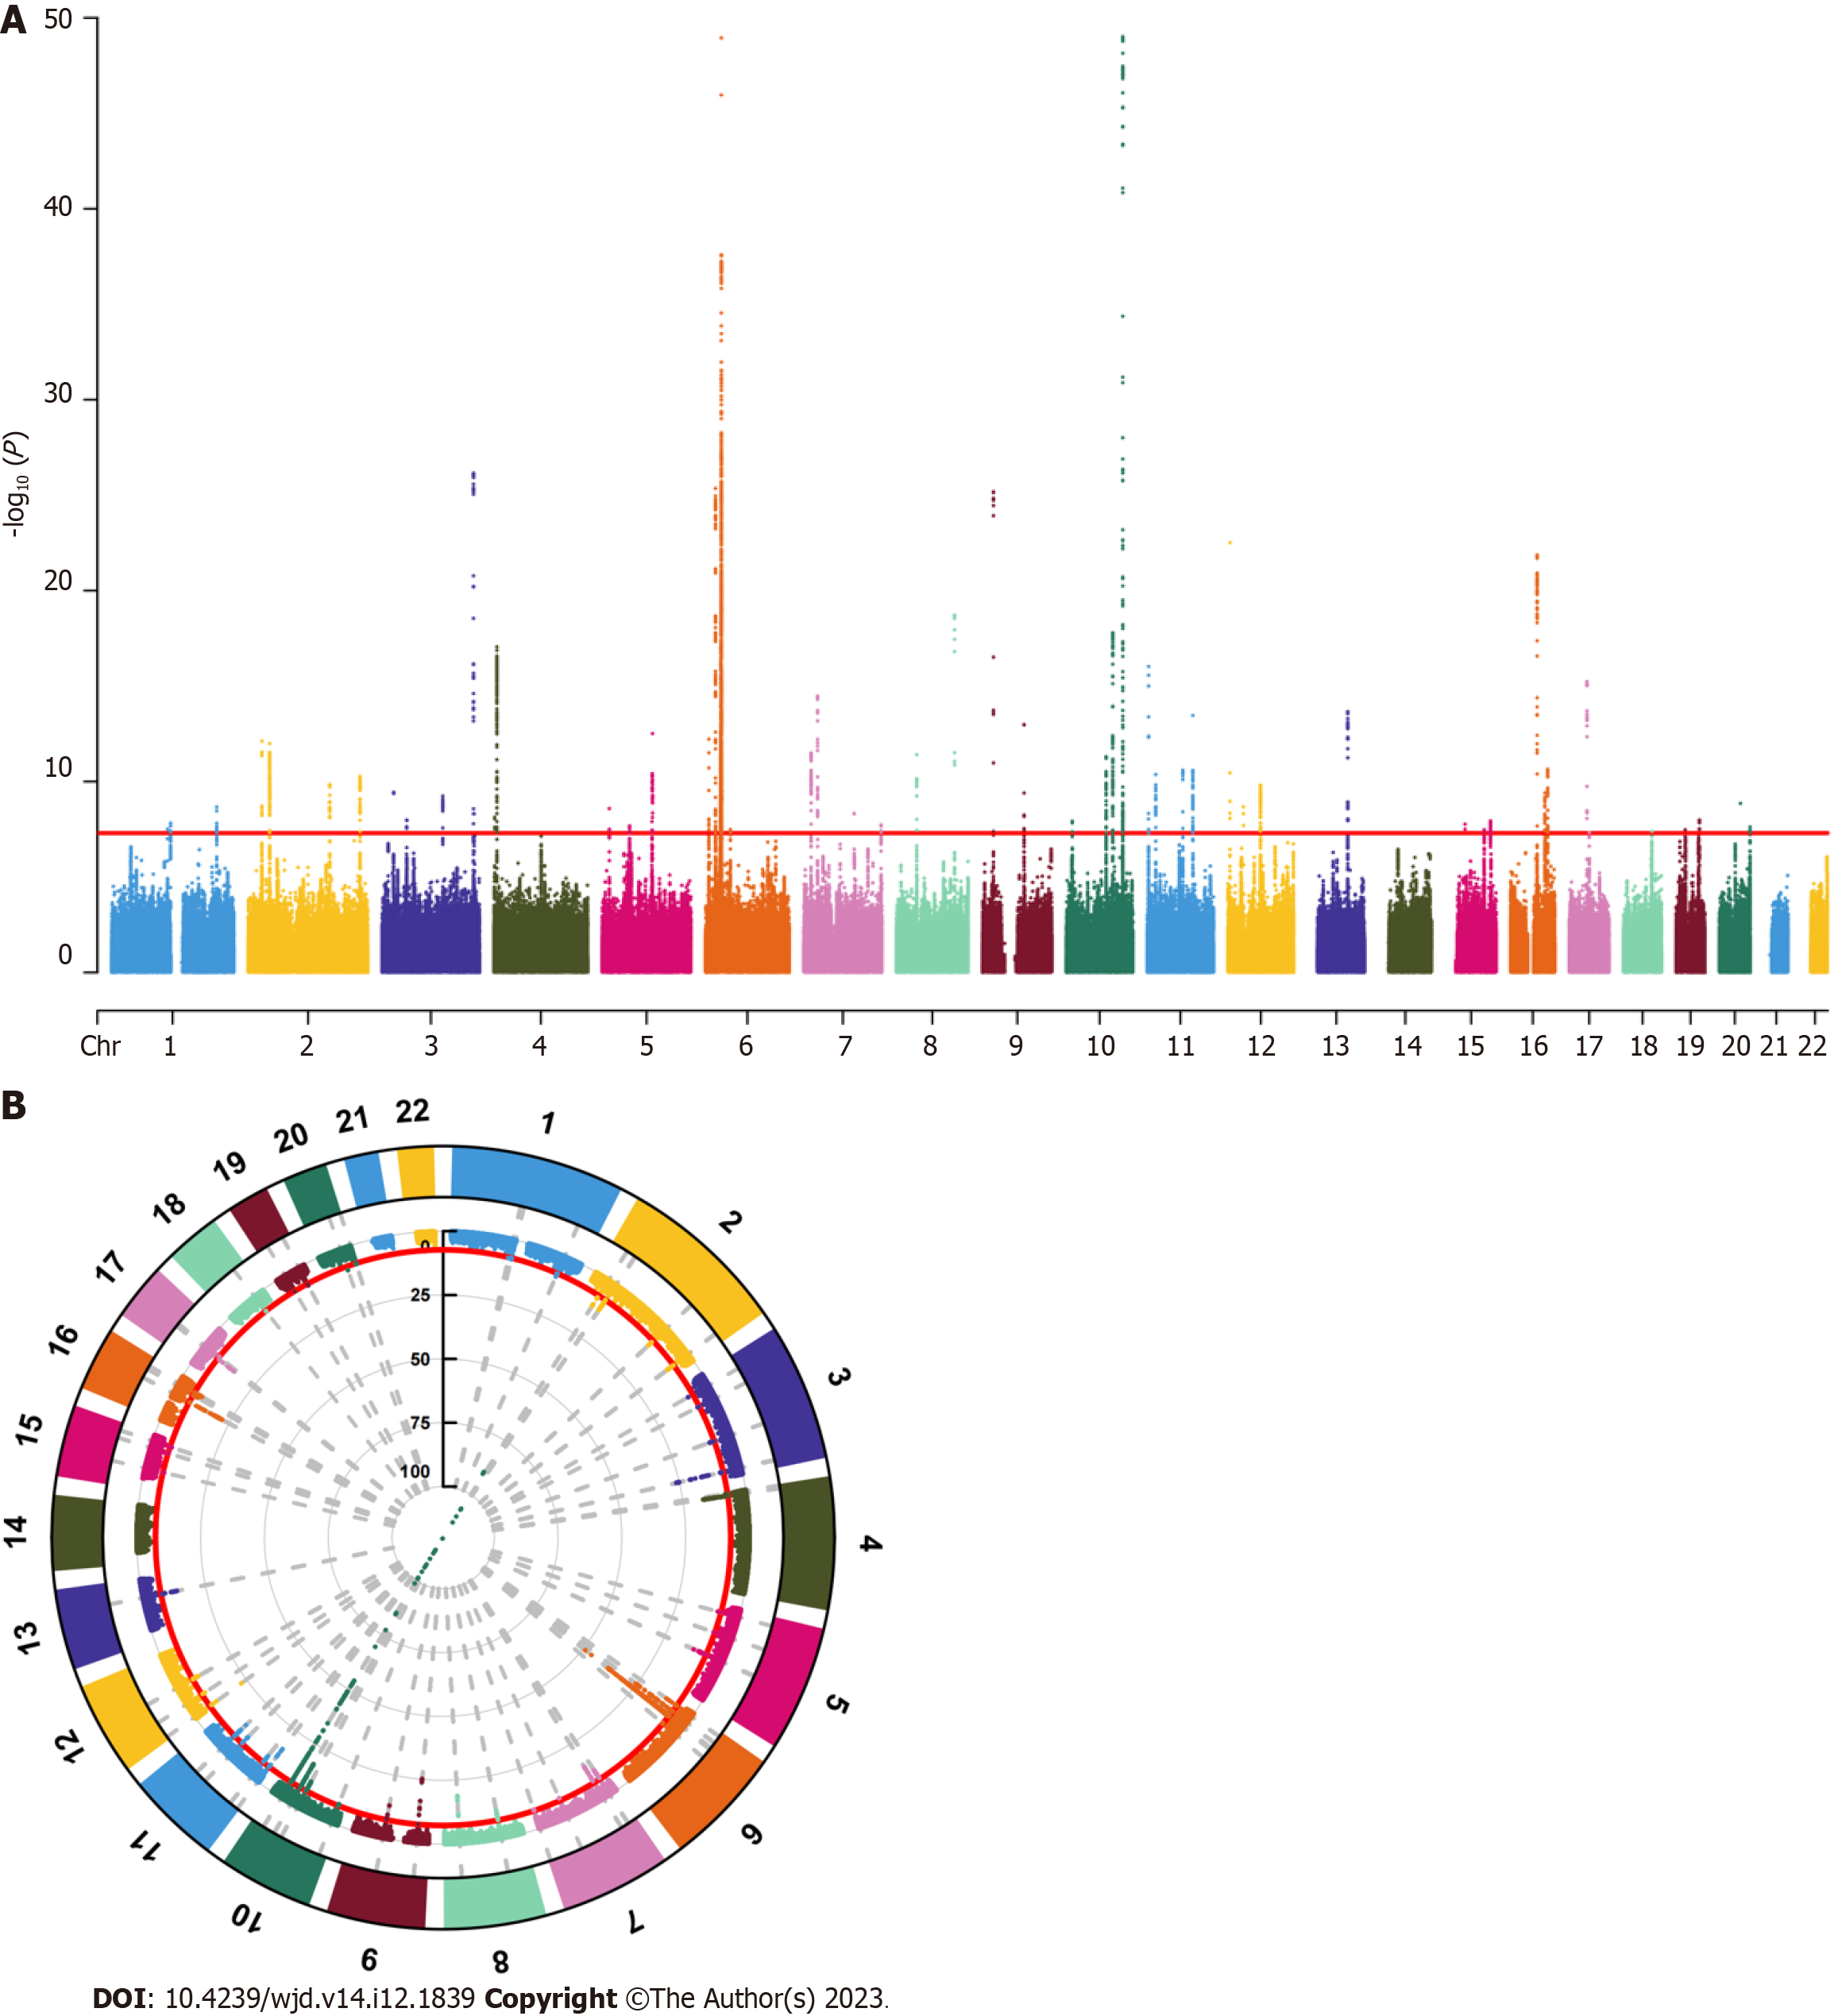
Figure 1 Selection of instrumental variables.
A: Manhattan plot (line graph); B: Manhattan plot (cyclic graph). The red lines represent the filtering conditions of P < 5 × 10⁻⁸.
- Citation: Yuan JX, Jiang Q, Yu SJ. Diabetes mellitus and prostate cancer risk: A mendelian randomization analysis. World J Diabetes 2023; 14(12): 1839-1848
- URL: https://www.wjgnet.com/1948-9358/full/v14/i12/1839.htm
- DOI: https://dx.doi.org/10.4239/wjd.v14.i12.1839


