Copyright
©The Author(s) 2023.
World J Diabetes. Oct 15, 2023; 14(10): 1562-1572
Published online Oct 15, 2023. doi: 10.4239/wjd.v14.i10.1562
Published online Oct 15, 2023. doi: 10.4239/wjd.v14.i10.1562
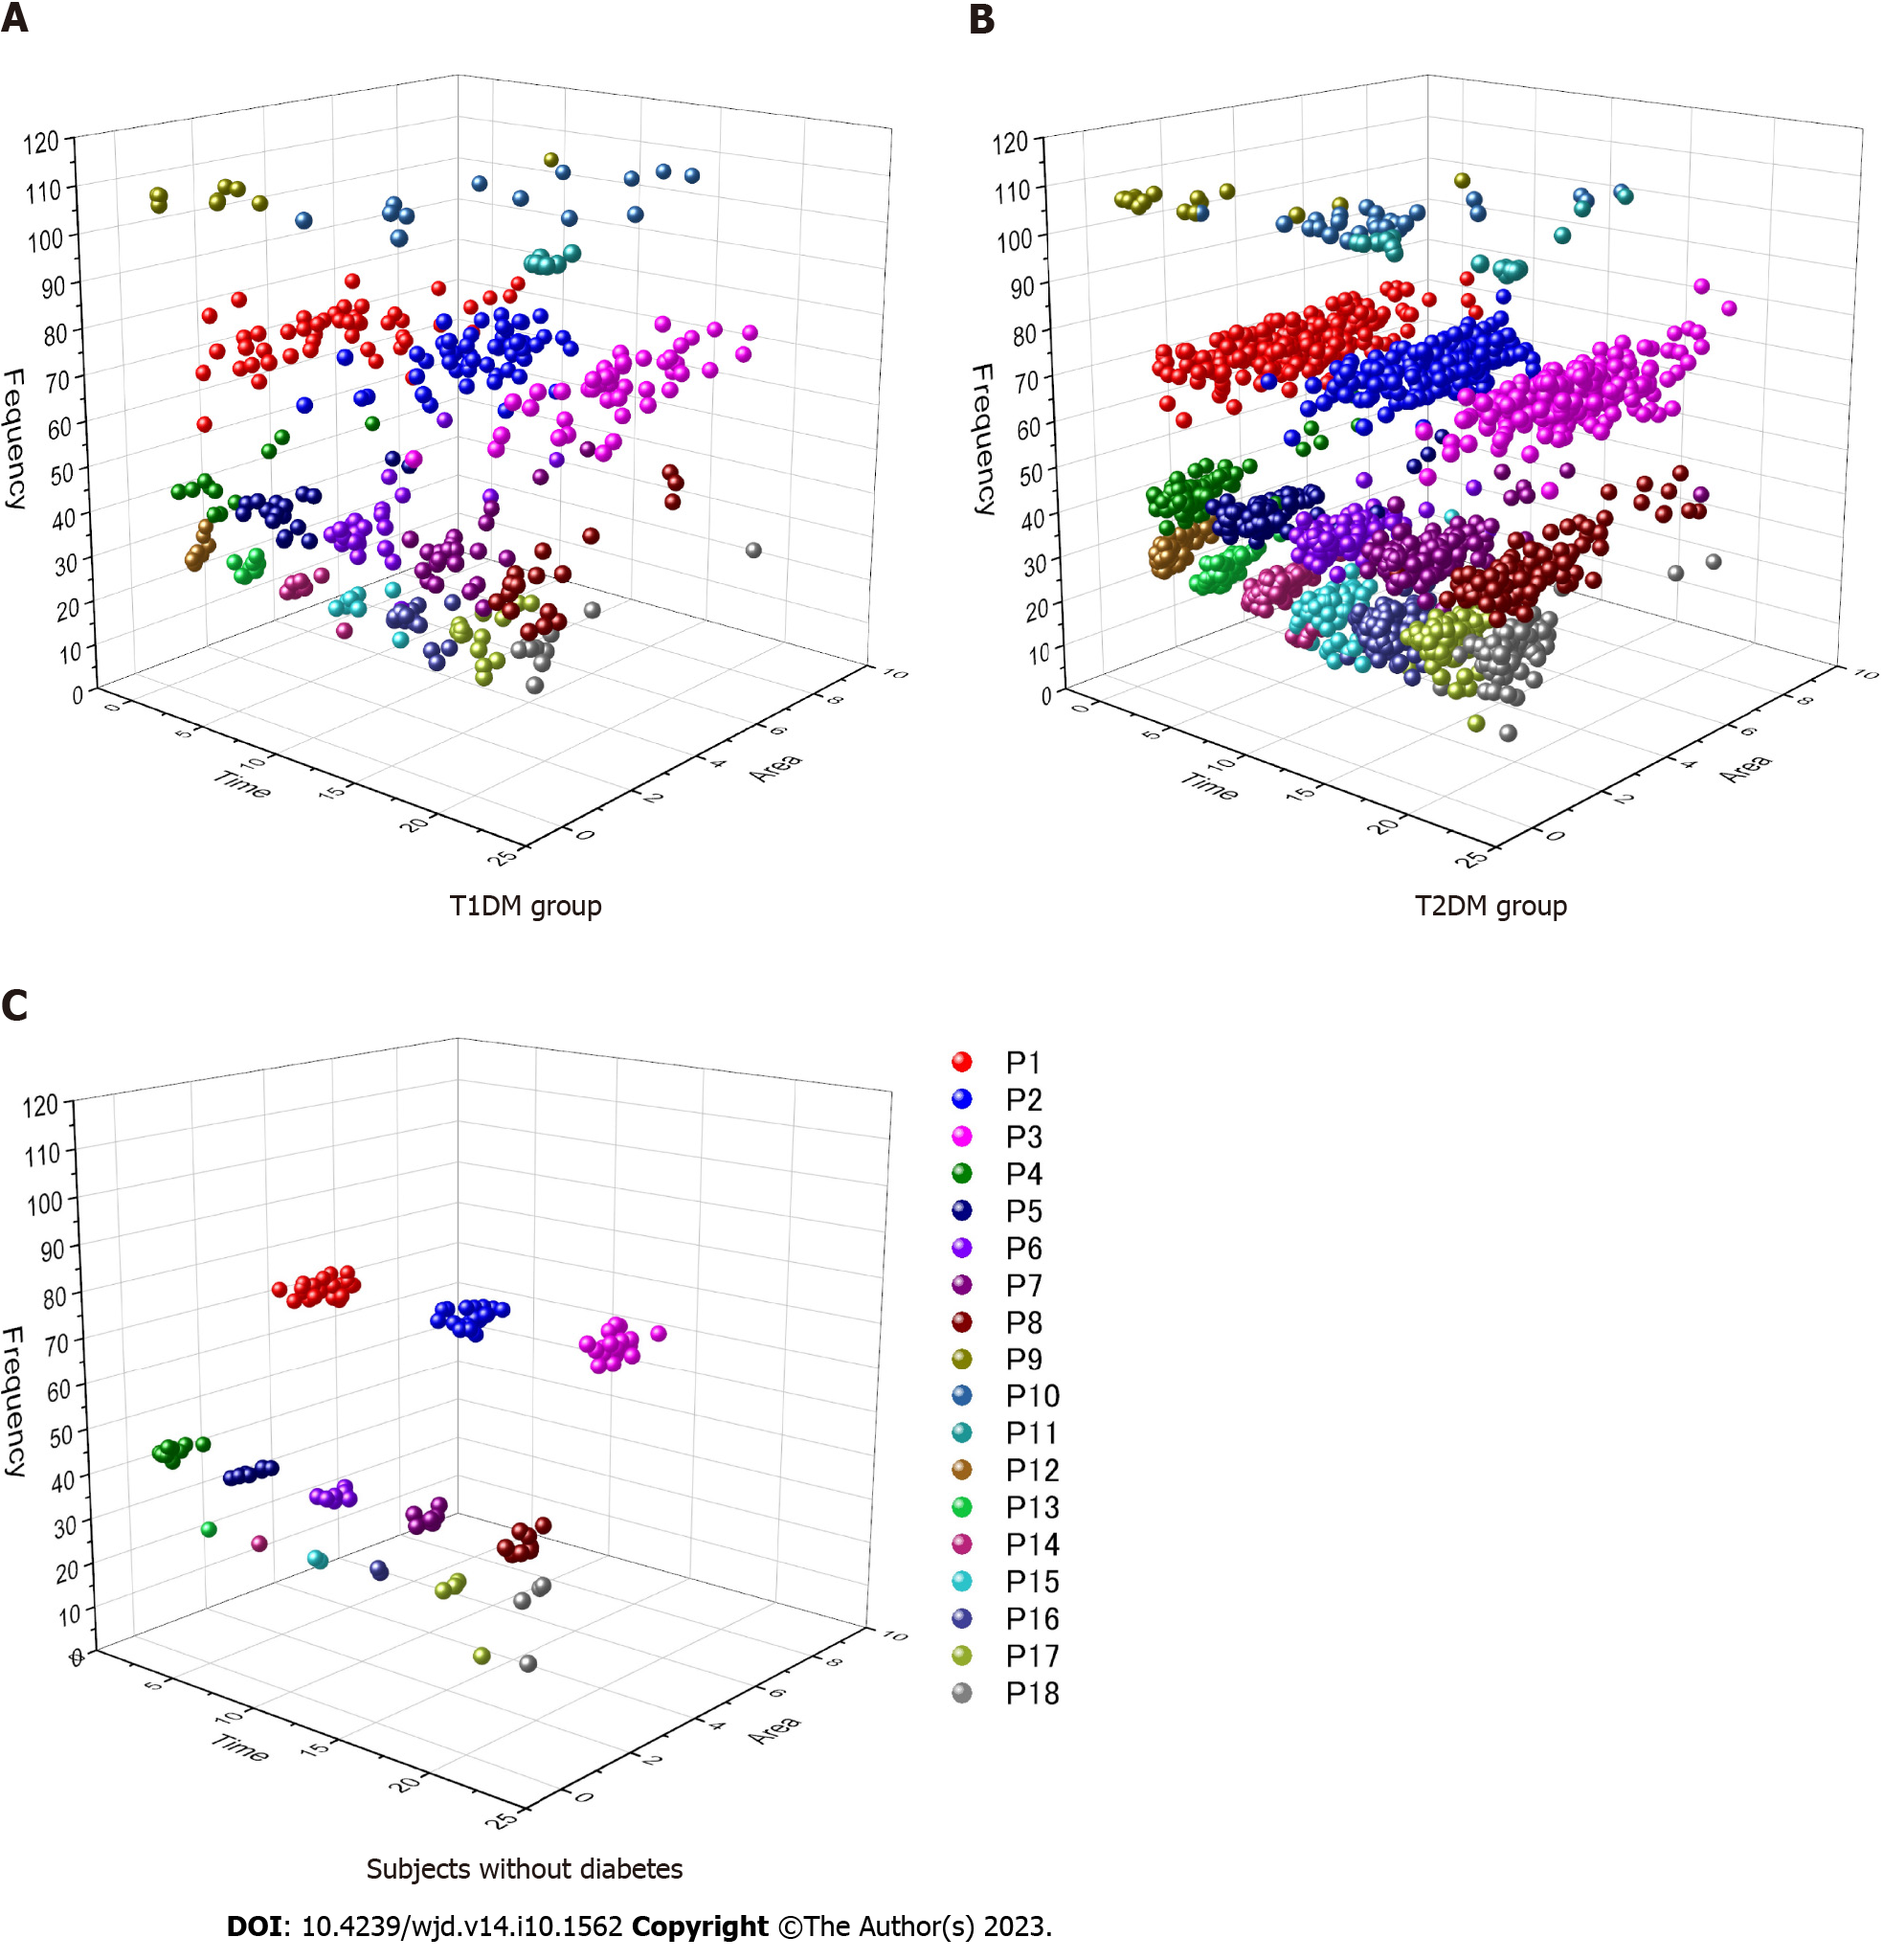
Figure 2 Comparison of the three-dimensional scattering diagram between groups.
The x-axis indicates time during a day; the y-axis indicates the area enclosed at the 0.02625 scalogram value; the z-axis indicates a pseudo-frequency determined after continuous wavelet transform processing. The wave cycles of P1 signals belonging to type 1 diabetes mellitus (T1DM) were distributed during 17-24 min. The loose distribution of P1 signal wave length characterized T1DM. A: Type 1 diabetes mellitus group; B: Type 2 diabetes mellitus group; C: Subjects without diabetes.
- Citation: Nakamura Y, Furukawa S. Characteristics of glucose change in diabetes mellitus generalized through continuous wavelet transform processing: A preliminary study. World J Diabetes 2023; 14(10): 1562-1572
- URL: https://www.wjgnet.com/1948-9358/full/v14/i10/1562.htm
- DOI: https://dx.doi.org/10.4239/wjd.v14.i10.1562


