Copyright
©The Author(s) 2023.
World J Diabetes. Oct 15, 2023; 14(10): 1541-1550
Published online Oct 15, 2023. doi: 10.4239/wjd.v14.i10.1541
Published online Oct 15, 2023. doi: 10.4239/wjd.v14.i10.1541
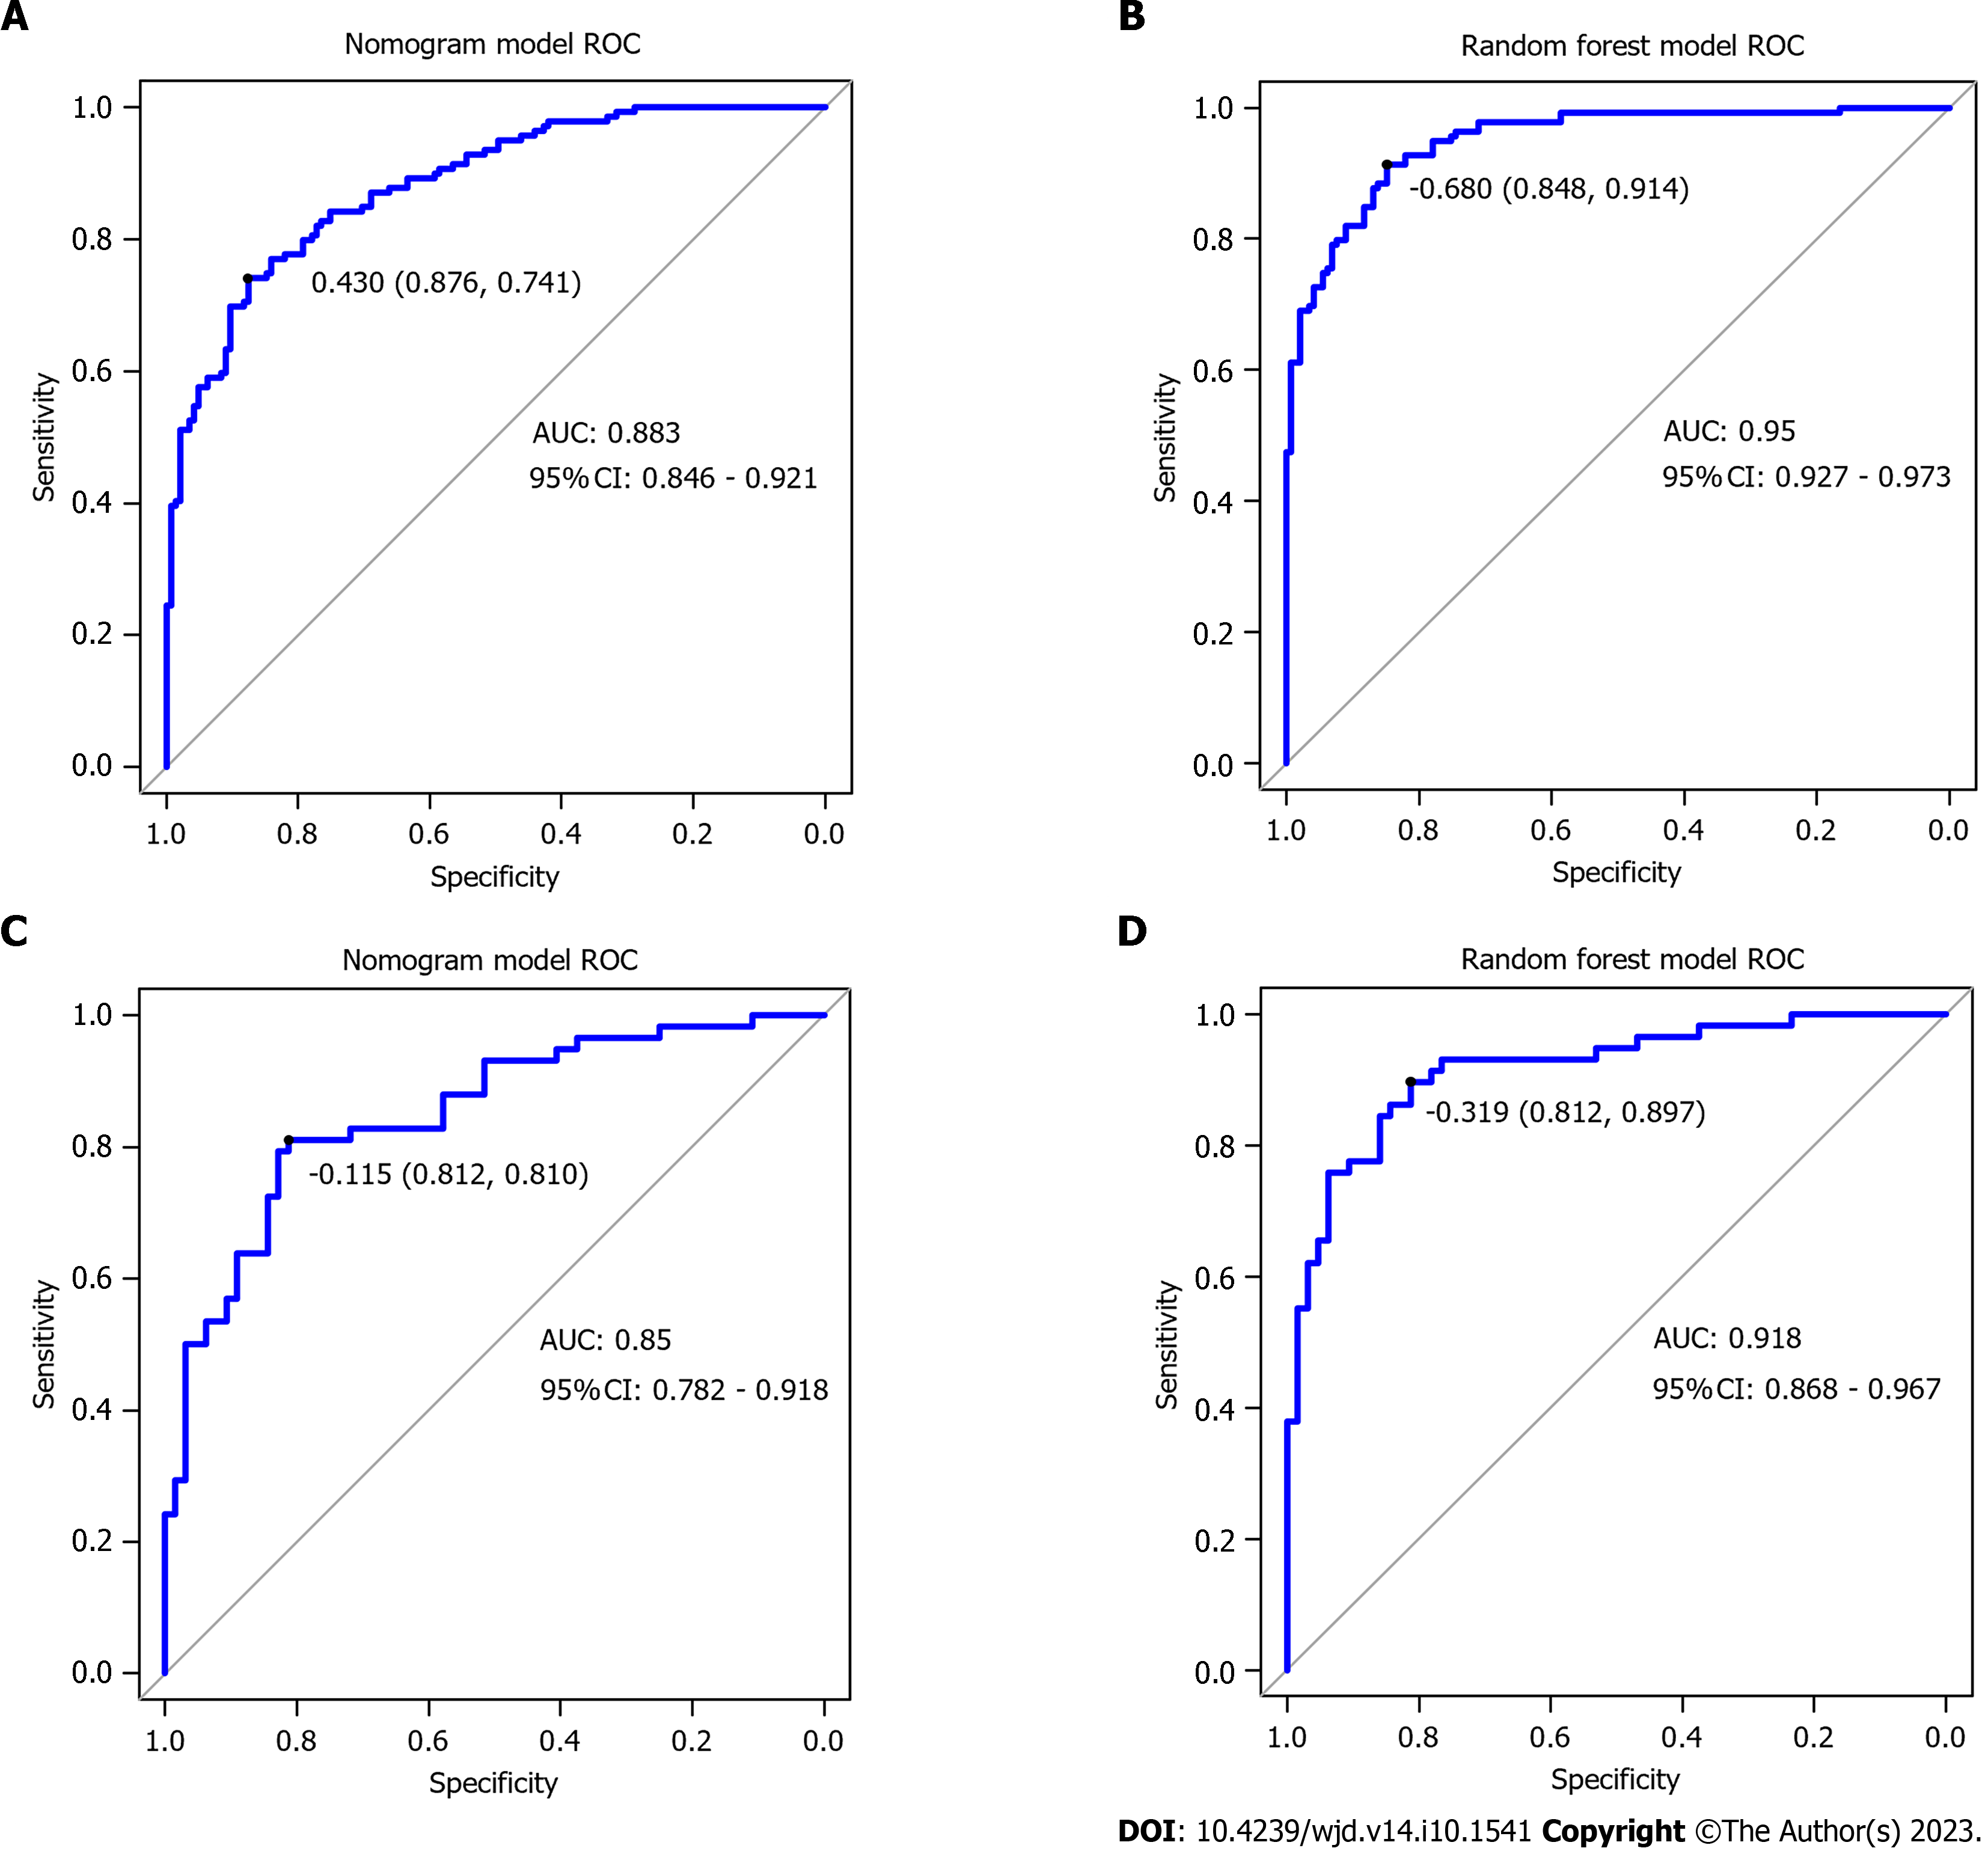
Figure 3 Receiver operating characteristic curve of the two models for predicting gestational diabetes mellitus.
A: The figure shows the receiver operating characteristic curve (ROC) curve of the training set nomogram; B: The figure shows the ROC curve of the training set random forest model; C: The figure shows the ROC curve of the validation set line graph; D: The figure shows the ROC curve of the validation set random forest model. ROC: Receiver operating characteristic curve; AUC: Area under the curve.
- Citation: Lin Q, Fang ZJ. Establishment and evaluation of a risk prediction model for gestational diabetes mellitus. World J Diabetes 2023; 14(10): 1541-1550
- URL: https://www.wjgnet.com/1948-9358/full/v14/i10/1541.htm
- DOI: https://dx.doi.org/10.4239/wjd.v14.i10.1541


