Copyright
©The Author(s) 2023.
World J Diabetes. Jan 15, 2023; 14(1): 48-61
Published online Jan 15, 2023. doi: 10.4239/wjd.v14.i1.48
Published online Jan 15, 2023. doi: 10.4239/wjd.v14.i1.48
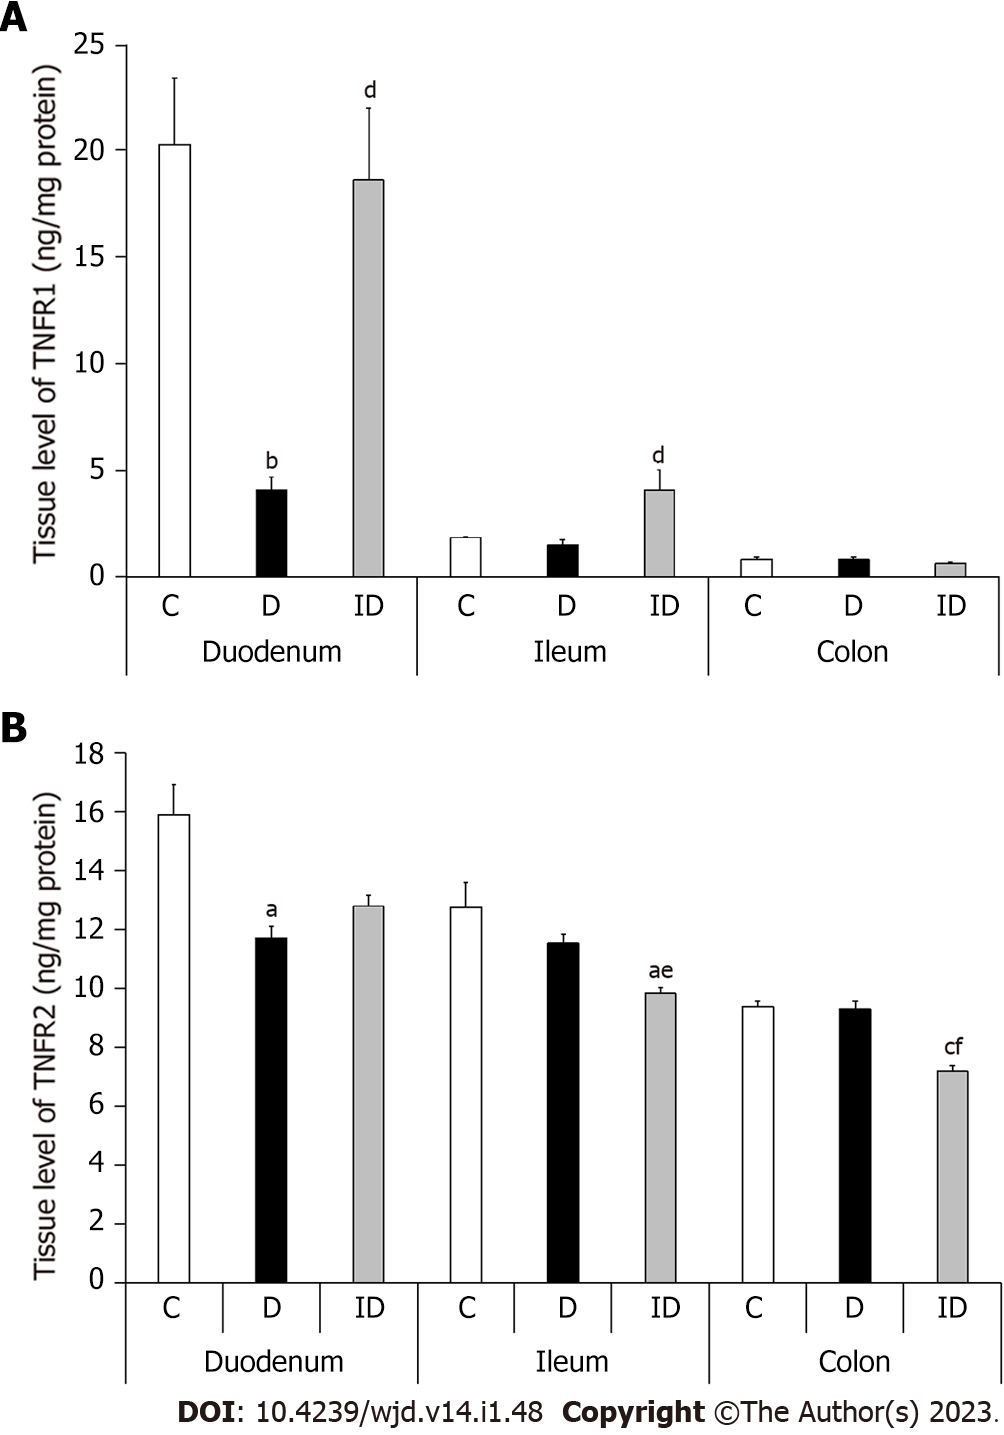
Figure 6 Tissue levels of TNFR1 and TNFR2 in intestinal smooth muscle layer homogenates including the myenteric plexus from the different gut segments of control, diabetic and insulin-treated diabetic rats.
A: TNFR1; B: TNFR2. Both the TNFR1 and TNFR2 levels decreased remarkably in the duodenum of diabetics, but they remained unchanged in other segments. Data are expressed as means ± SE. aP < 0.01, bP < 0.001, cP < 0.0001 (relative to the controls). dP < 0.01, eP < 0.001, fP < 0.0001 (between diabetics and insulin-treated diabetics). C: Controls; D: Diabetics; ID: Insulin-treated diabetics.
- Citation: Barta BP, Onhausz B, AL Doghmi A, Szalai Z, Balázs J, Bagyánszki M, Bódi N. Gut region-specific TNFR expression: TNFR2 is more affected than TNFR1 in duodenal myenteric ganglia of diabetic rats. World J Diabetes 2023; 14(1): 48-61
- URL: https://www.wjgnet.com/1948-9358/full/v14/i1/48.htm
- DOI: https://dx.doi.org/10.4239/wjd.v14.i1.48


