Copyright
©The Author(s) 2022.
World J Diabetes. Sep 15, 2022; 13(9): 765-775
Published online Sep 15, 2022. doi: 10.4239/wjd.v13.i9.765
Published online Sep 15, 2022. doi: 10.4239/wjd.v13.i9.765
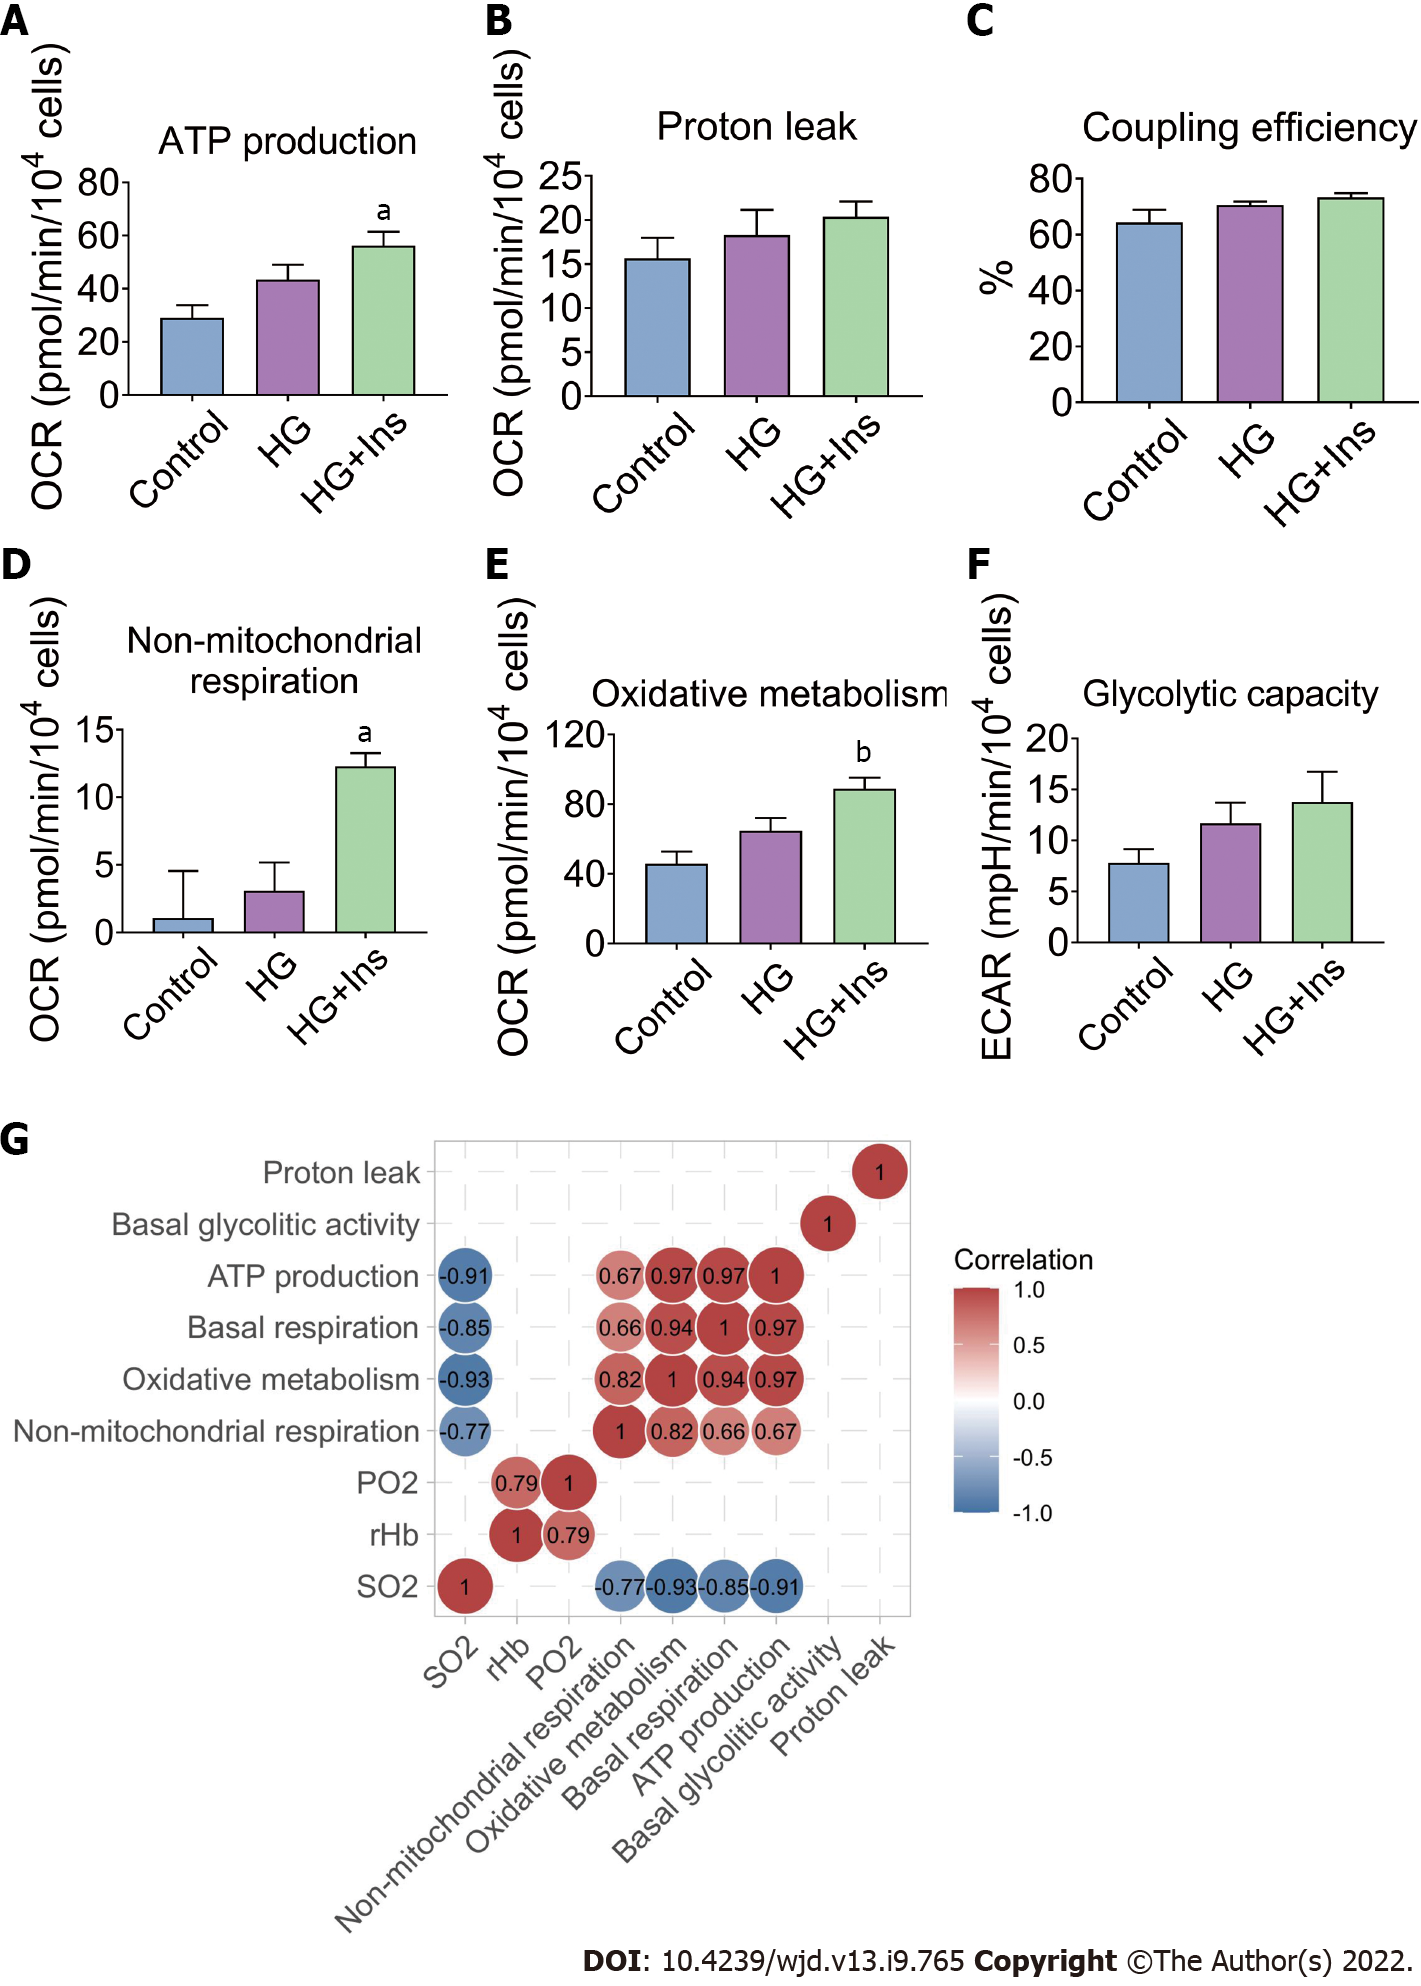
Figure 5 Metabolic characteristics of the islet microvascular endothelial cells.
A-E: Oxygen consumption rates associated with mitochondrial ATP production, proton leak, coupling efficiency, non-mitochondrial respiration and oxidative metabolism; F: Endothelial glycolytic capacity evaluated by extracellular acidification rate; The data are presented as the mean ± SEM, n = 4 for each group. aP < 0.05, bP < 0.01 vs Control; G: The correlation analysis among pancreatic microcirculatory oxygen profile and microvascular endothelial mitochondrial metabolism. The correlation coefficients (r) in the control, glucotoxicity-exposed, and insulin-treated groups are illustrated as matrix plots. The numbers in the figure represent the correlation coefficient (r) values. SO2: oxygen saturation; rHb, relative amount of hemoglobin; PO2: partial oxygen pressure. OCR: Oxygen consumption rate; HG: High glucose; Ins: Insulin.
- Citation: Li BW, Li Y, Zhang X, Fu SJ, Wang B, Zhang XY, Liu XT, Wang Q, Li AL, Liu MM. Role of insulin in pancreatic microcirculatory oxygen profile and bioenergetics. World J Diabetes 2022; 13(9): 765-775
- URL: https://www.wjgnet.com/1948-9358/full/v13/i9/765.htm
- DOI: https://dx.doi.org/10.4239/wjd.v13.i9.765


