Copyright
©The Author(s) 2022.
World J Diabetes. Sep 15, 2022; 13(9): 765-775
Published online Sep 15, 2022. doi: 10.4239/wjd.v13.i9.765
Published online Sep 15, 2022. doi: 10.4239/wjd.v13.i9.765
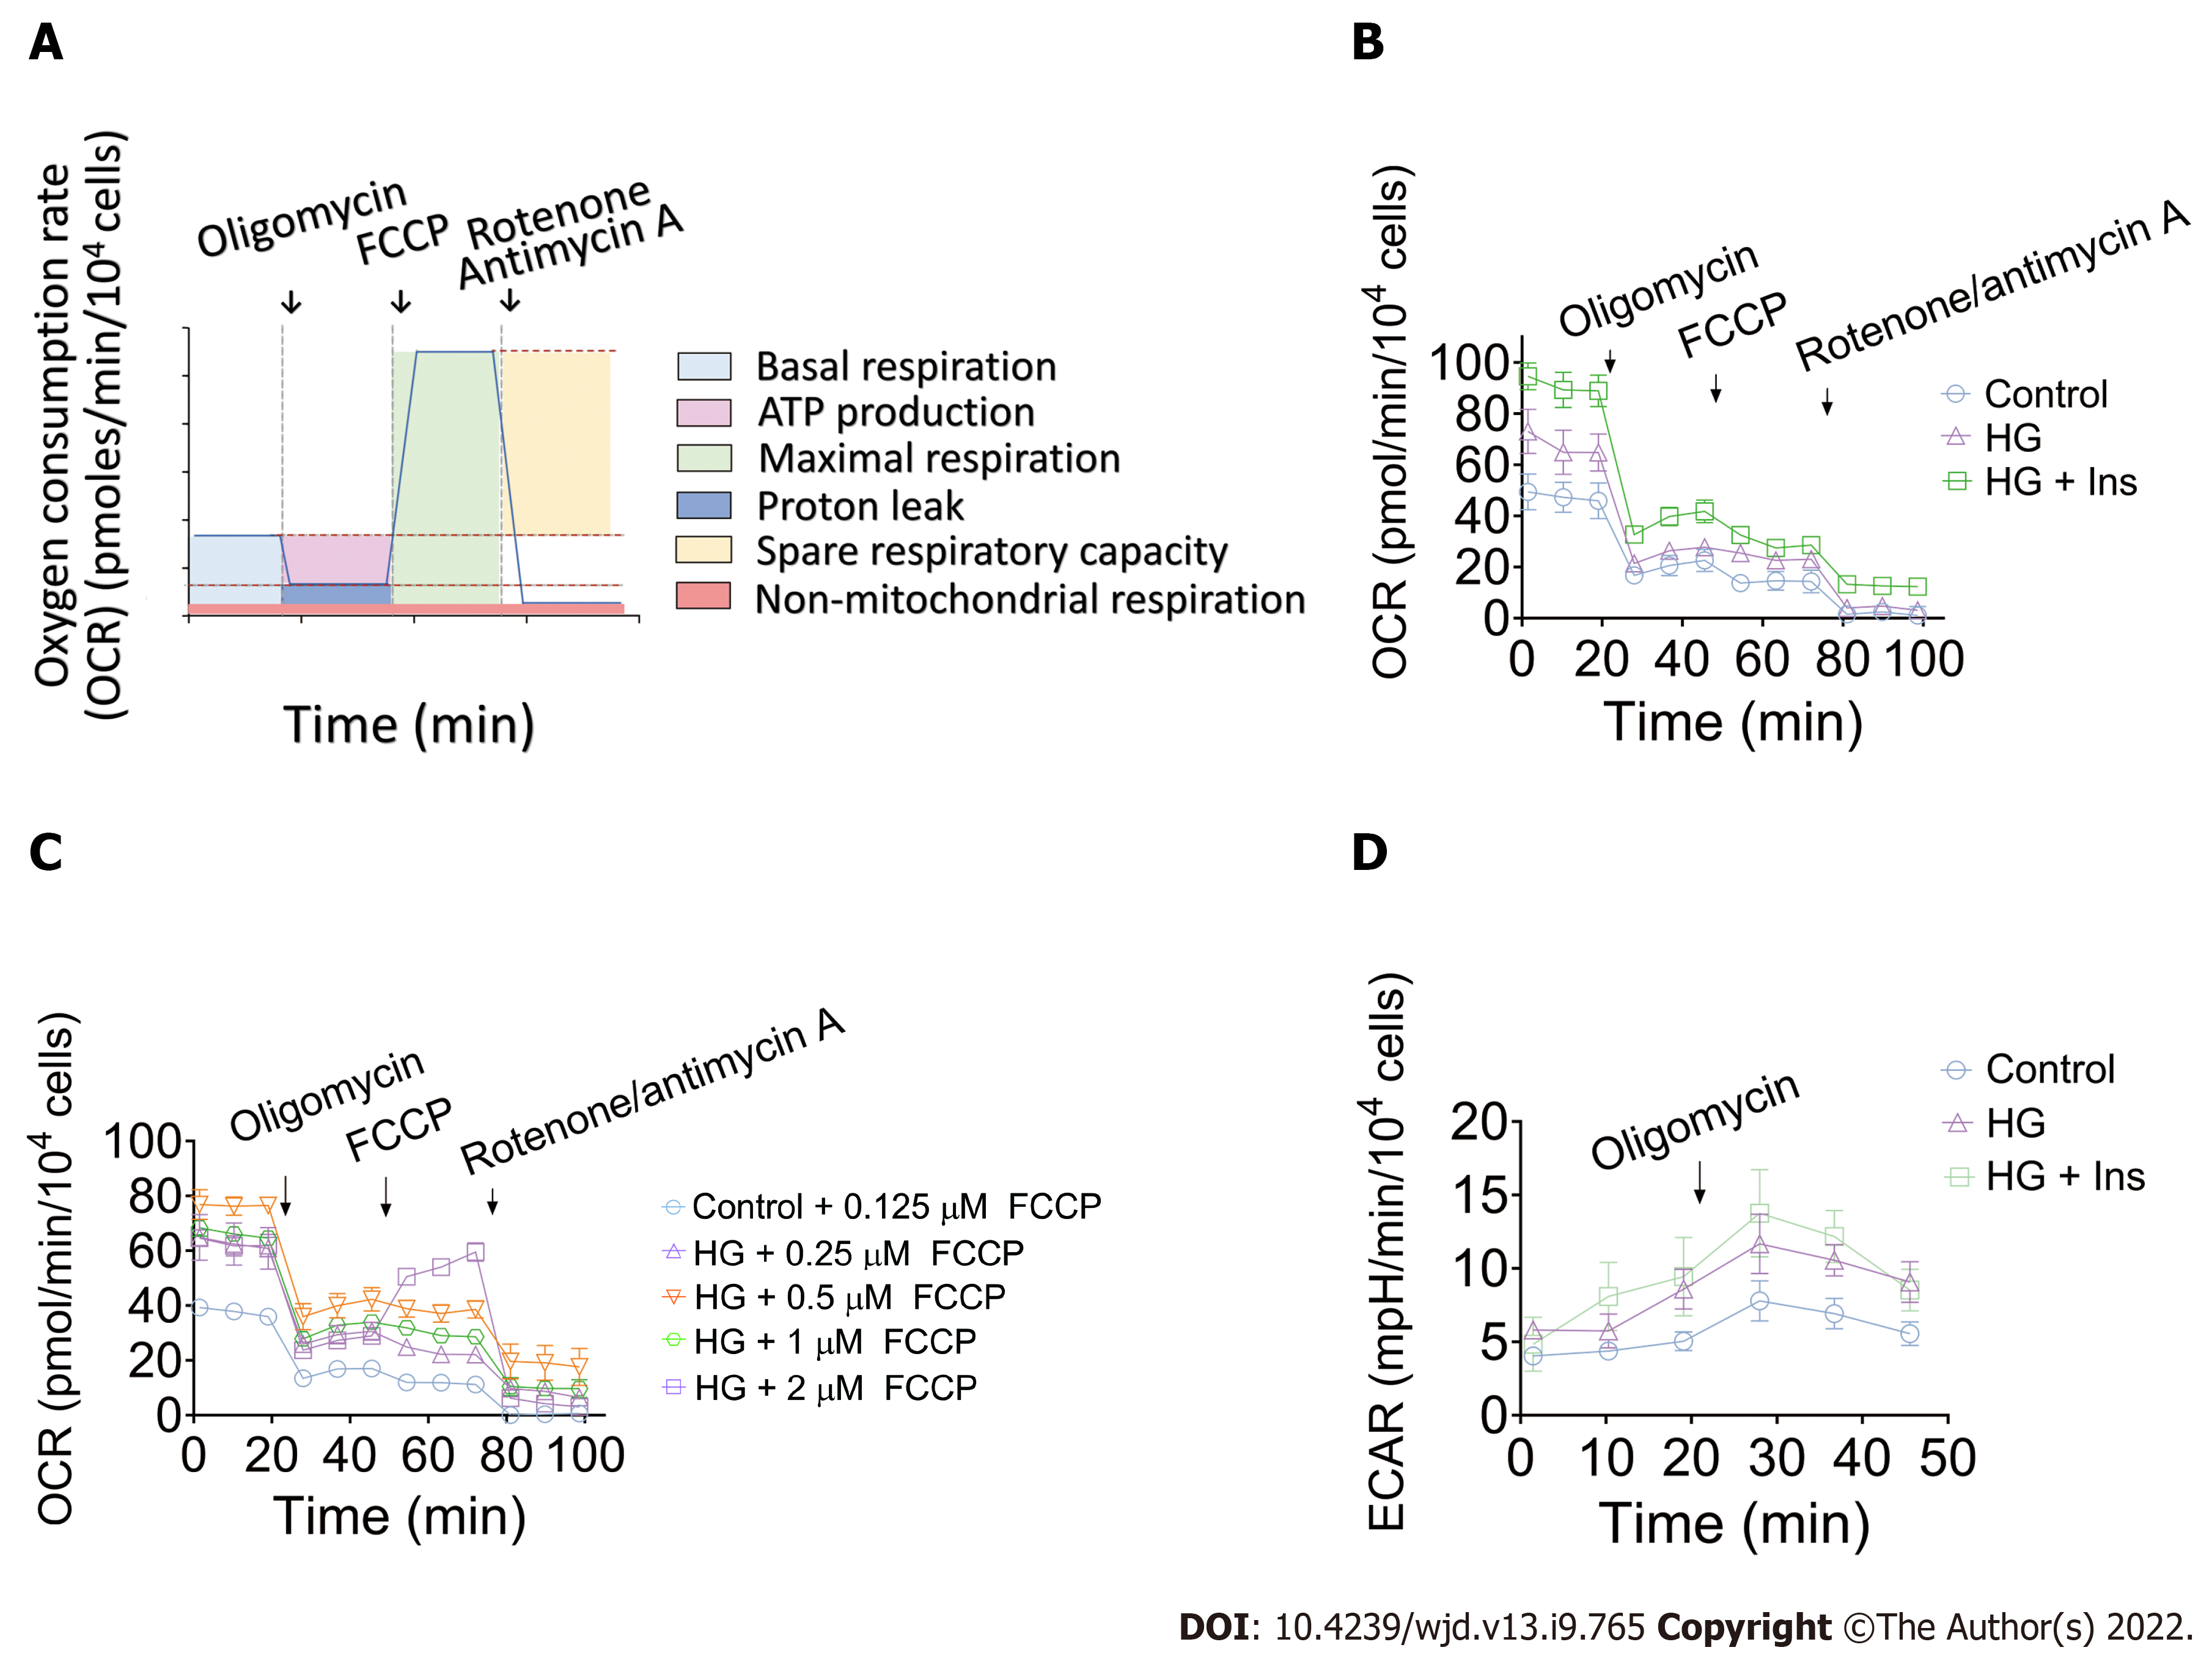
Figure 3 Characterization of mitochondrial function in the control, glucotoxicity-exposed, and insulin-treated islet microvascular endothelial cell groups.
A: Schematic representation of real-time mitochondrial respiration. The parameters of mitochondrial function were measured by kinetic oxygen consumption rate (OCR) analysis, starting from basal detection and after the injection of oligomycin (complex V inhibition), carbonyl cyanide 4-(trifluoromethoxy) phenylhydrazone (FCCP, maximal respiration induction), and rotenone/antimycin A mixture (electron transport chain inhibition). Non-mitochondrial respiration was directly measured. Basal respiration, ATP production, maximal respiration, proton leak, and mitochondrial spare respiratory capacity were then calculated according to the OCR curve; B: Representative kinetic curve of mitochondrial OCR in control, glucotoxicity-exposed islet microvascular endothelial cells (IMECs) (HG), and insulin-treated IMECs (HG + Ins) after sequential injection of oligomycin, FCCP, and rotenone/antimycin A; C: Representative kinetic curve of mitochondrial OCR in control and glucotoxicity-exposed IMECs (HG) after sequential injection of gradient FCCP concentrations; D: Representative kinetic curve of extracellular acidification rate (ECAR) after injection of oligomycin. The peak values of ECAR reflect the glycolytic capacity. The data are presented as the mean ± SEM, n = 4 for each group. OCR: Oxygen consumption rate; FCCP: Carbonyl cyanide 4-(trifluoromethoxy) phenylhydrazone; HG: High glucose; Ins: Insulin.
- Citation: Li BW, Li Y, Zhang X, Fu SJ, Wang B, Zhang XY, Liu XT, Wang Q, Li AL, Liu MM. Role of insulin in pancreatic microcirculatory oxygen profile and bioenergetics. World J Diabetes 2022; 13(9): 765-775
- URL: https://www.wjgnet.com/1948-9358/full/v13/i9/765.htm
- DOI: https://dx.doi.org/10.4239/wjd.v13.i9.765


