Copyright
©The Author(s) 2022.
World J Diabetes. Aug 15, 2022; 13(8): 622-642
Published online Aug 15, 2022. doi: 10.4239/wjd.v13.i8.622
Published online Aug 15, 2022. doi: 10.4239/wjd.v13.i8.622
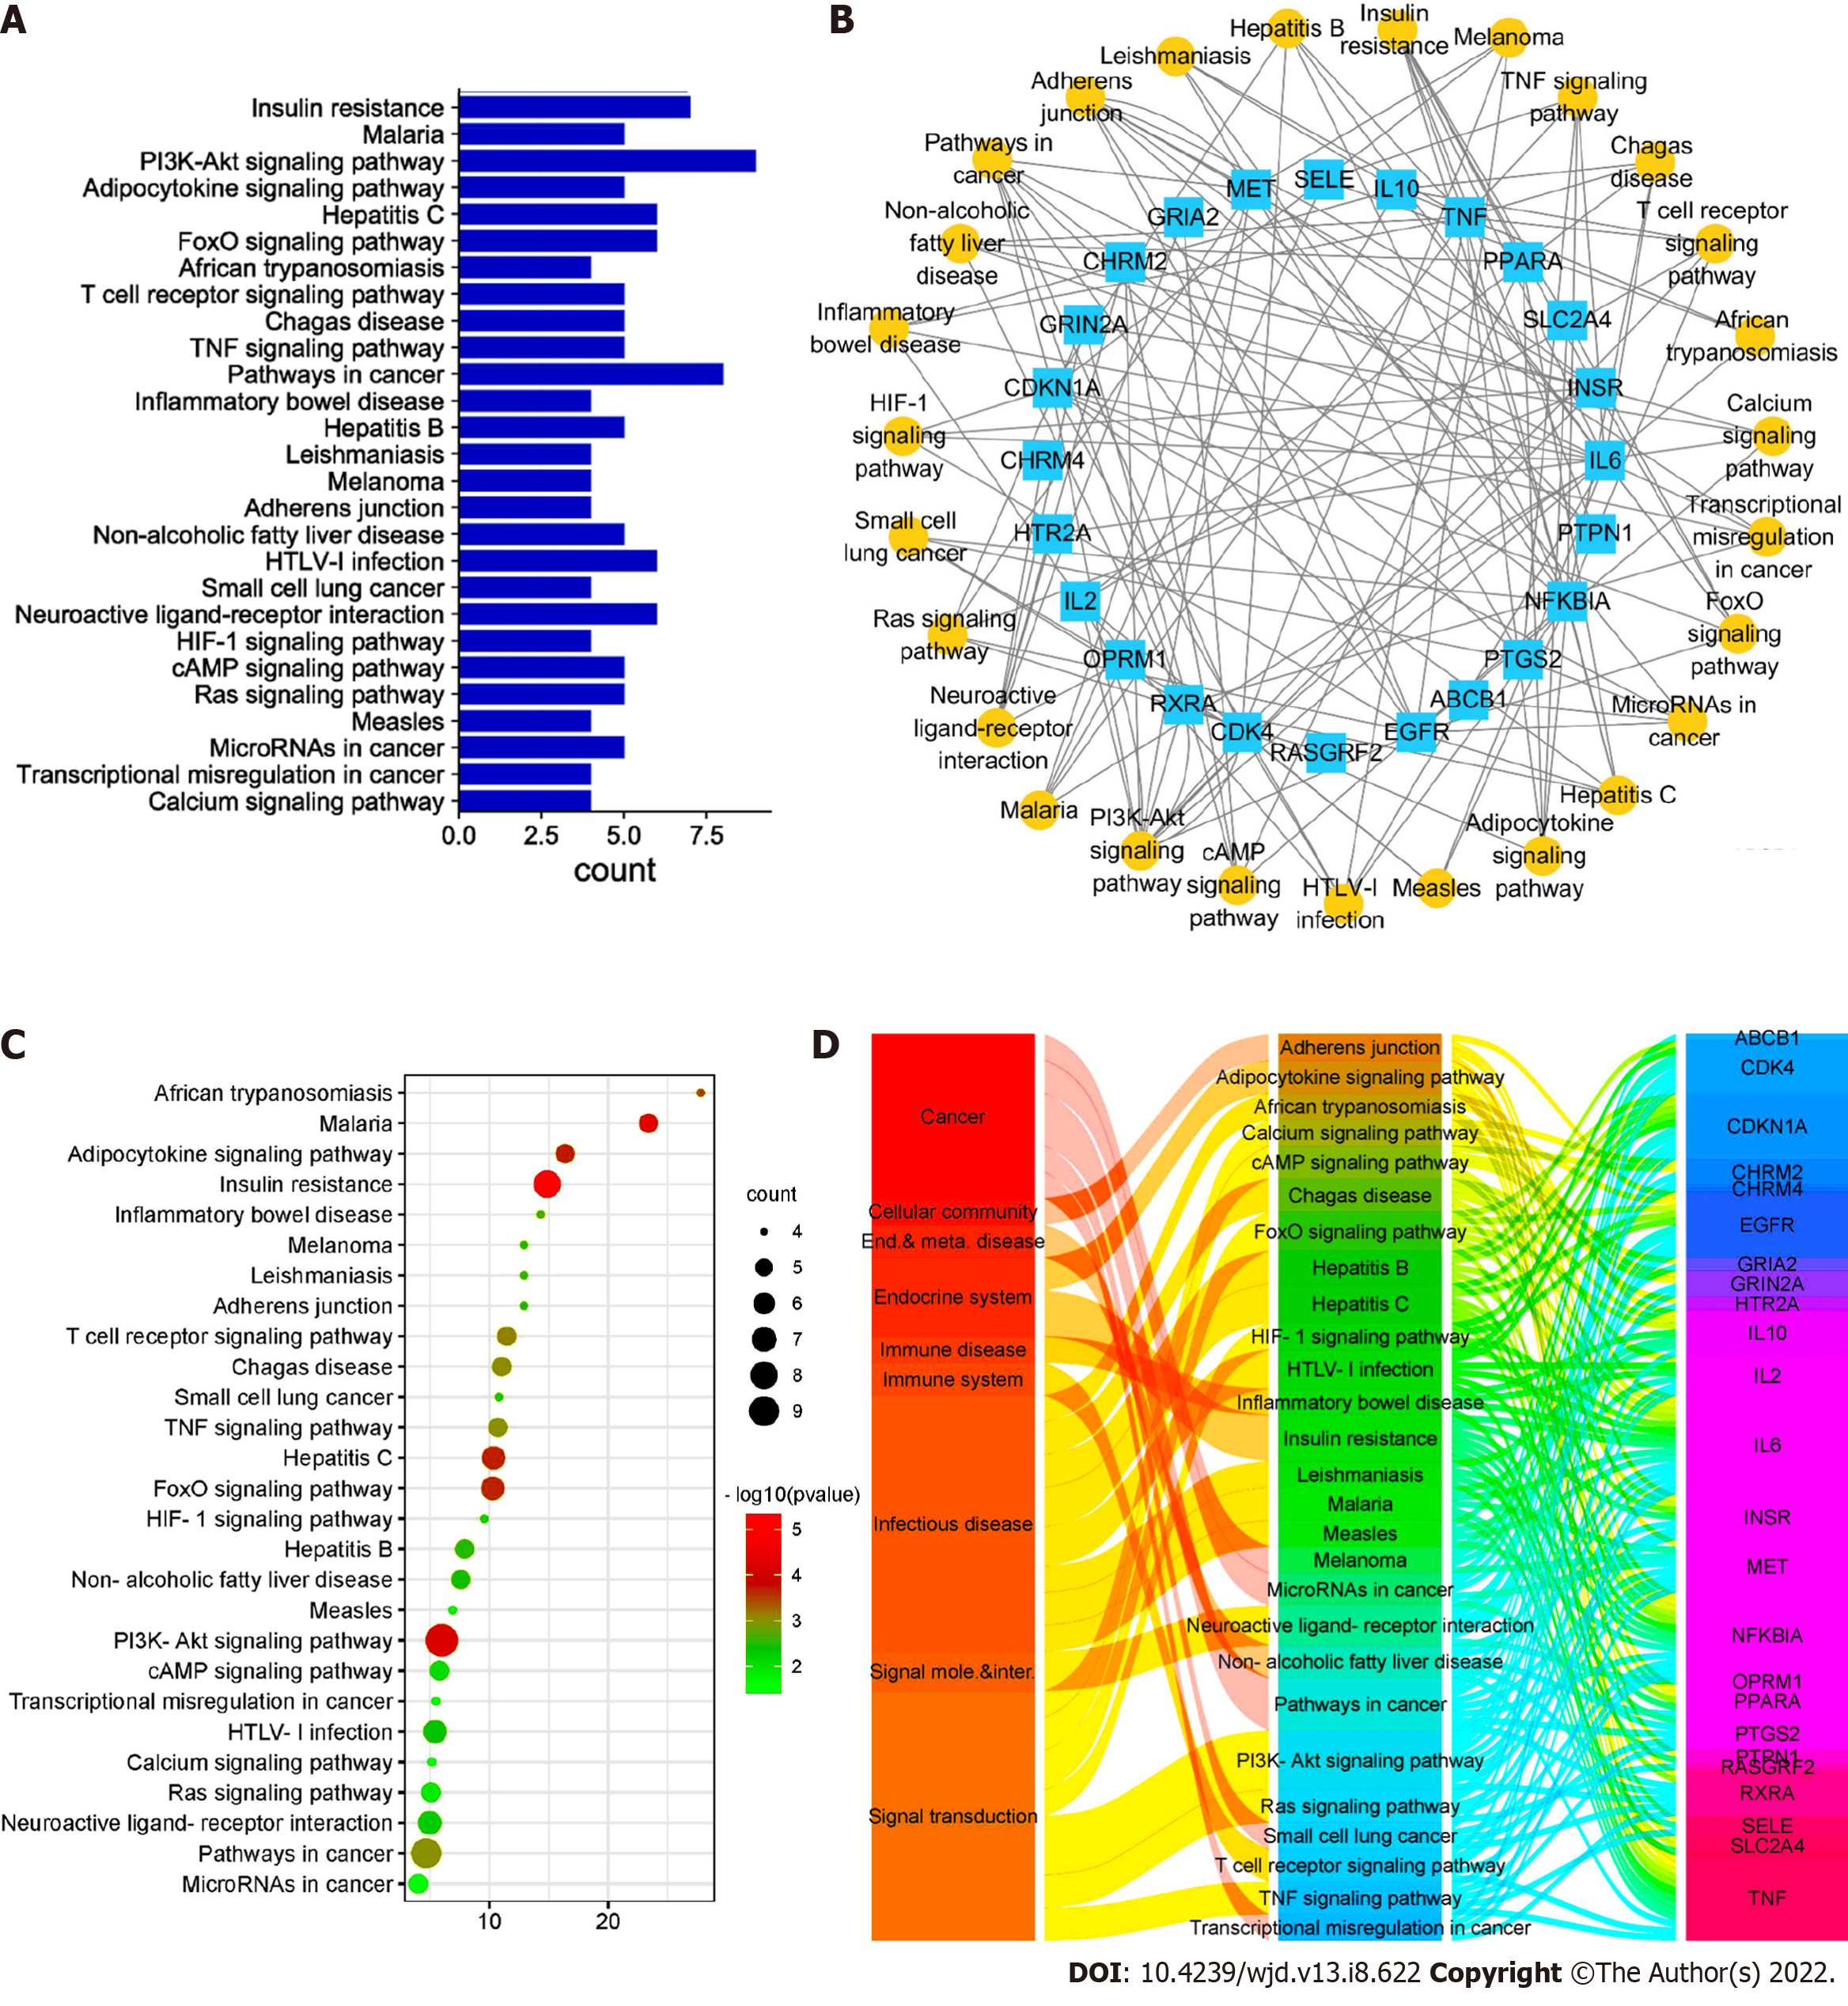
Figure 7 Target-pathway diagram of Ruyi Jinhuang powder-diabetic foot ulcer.
A: A bar graph of Kyoto Encyclopedia of Genes and Genomes (KEGG) signal pathway enrichment. The left side is the pathway name, and the right side is the number of targets contained; B: The target-path network relationship diagram. The yellow circle represents 27 pathways, and the blue square represents 36 targets; C: An enriched bubble diagram of the KEGG signaling pathway. The left side is the pathway name, and the abscissa is the fold enrichment. The bubble size corresponds to the number of targets contained, and the color category corresponds to the P value; D: The correspondence diagram of pathway categories. The first column is the ownership of the pathway, the second column is the pathway, and the third column is the target.
- Citation: Li XY, Zhang XT, Jiao YC, Chi H, Xiong TT, Zhang WJ, Li MN, Wang YH. In vivo evaluation and mechanism prediction of anti-diabetic foot ulcer based on component analysis of Ruyi Jinhuang powder. World J Diabetes 2022; 13(8): 622-642
- URL: https://www.wjgnet.com/1948-9358/full/v13/i8/622.htm
- DOI: https://dx.doi.org/10.4239/wjd.v13.i8.622


