Copyright
©The Author(s) 2022.
World J Diabetes. Aug 15, 2022; 13(8): 622-642
Published online Aug 15, 2022. doi: 10.4239/wjd.v13.i8.622
Published online Aug 15, 2022. doi: 10.4239/wjd.v13.i8.622
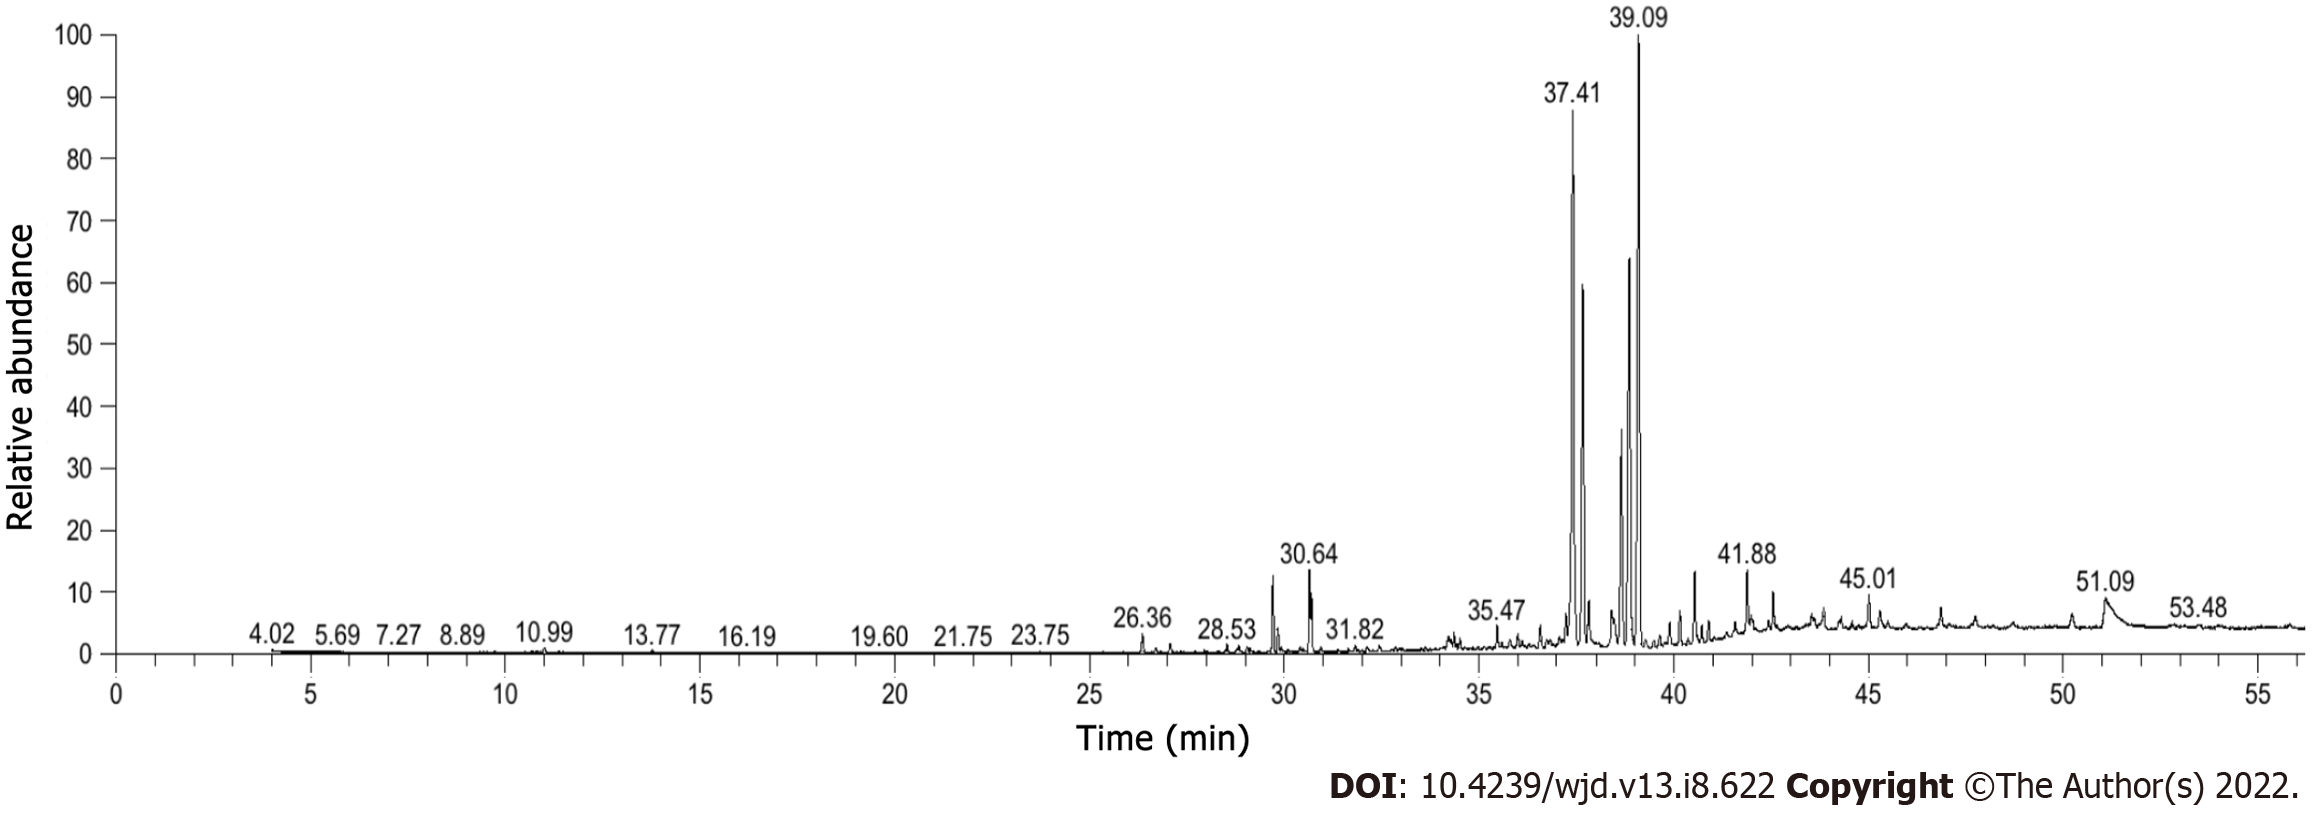
Figure 2 The total ion flow diagram of gas chromatography–mass spectrometry.
Among them, the higher components were ar-turmerone 24.33%, tumerone 20.74%, agarospirol 13.80%, β-eudesmol 9.06%, palmitic acid 2.31%, (E) atlantone 2.23%, β-quadruphellandrene 1.95%, methyloleate 1.87%, α-zingiberene 1.86%, and methylmitate 1.75%.
- Citation: Li XY, Zhang XT, Jiao YC, Chi H, Xiong TT, Zhang WJ, Li MN, Wang YH. In vivo evaluation and mechanism prediction of anti-diabetic foot ulcer based on component analysis of Ruyi Jinhuang powder. World J Diabetes 2022; 13(8): 622-642
- URL: https://www.wjgnet.com/1948-9358/full/v13/i8/622.htm
- DOI: https://dx.doi.org/10.4239/wjd.v13.i8.622


