Copyright
©The Author(s) 2022.
World J Diabetes. Mar 15, 2022; 13(3): 251-259
Published online Mar 15, 2022. doi: 10.4239/wjd.v13.i3.251
Published online Mar 15, 2022. doi: 10.4239/wjd.v13.i3.251
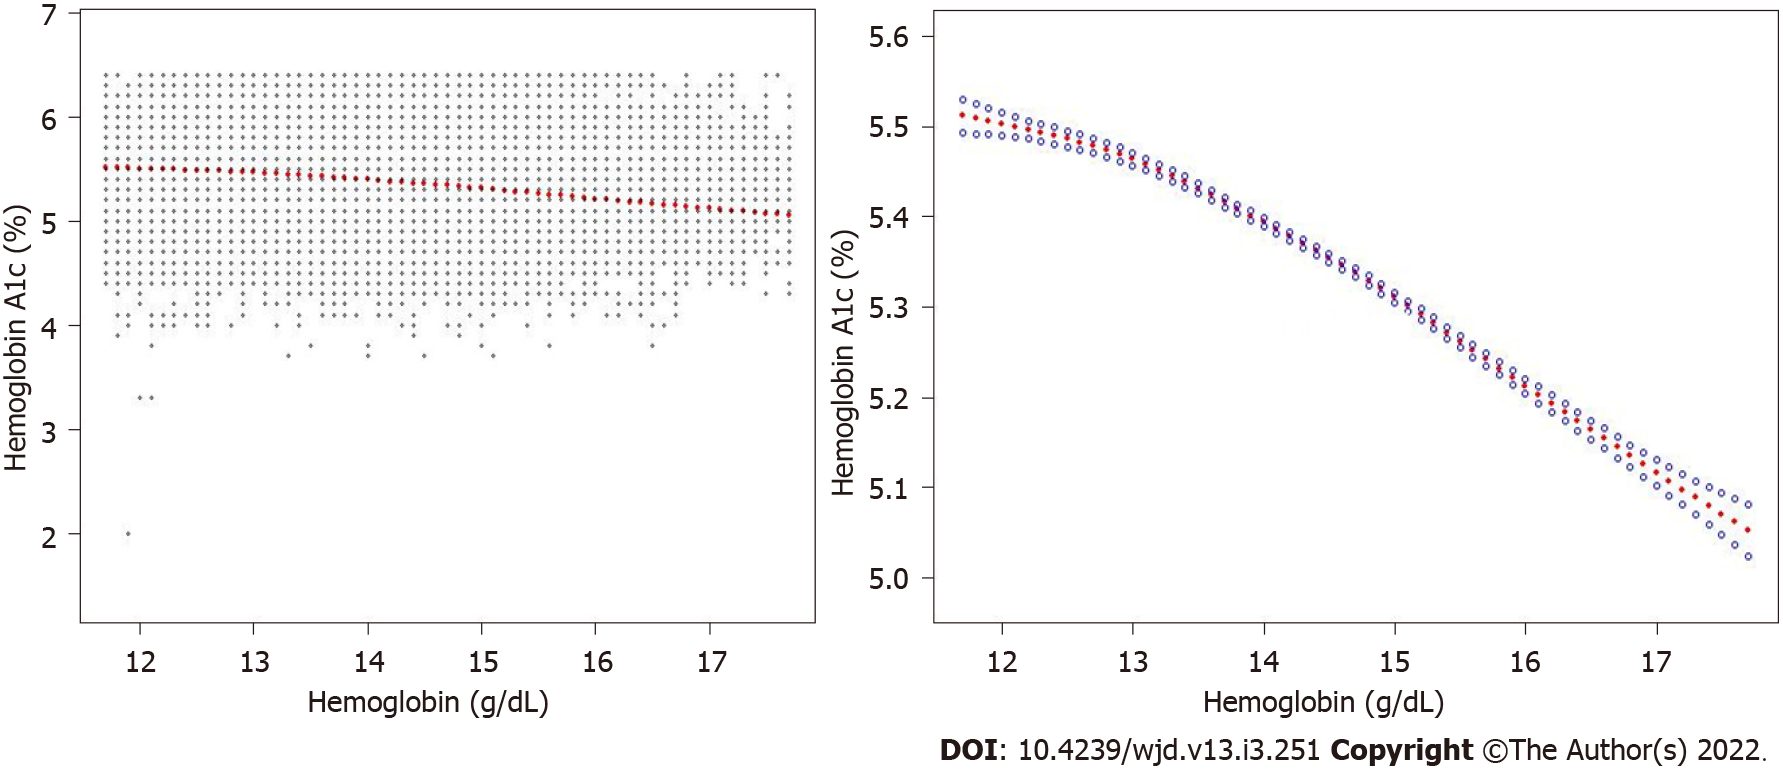
Figure 2 Relation between hemoglobin and hemoglobin A1c among participants.
Samples are shown in black points and smooth curve fitting data points is represented in solid red line. Besides, the 95%CI is represented in blue band. All parameters were modified, including age, gender, ethnicity, educational level, marital status, blood glucose, smoke behavior, body mass index, uric acid, total protein, alanine aminotransferase, cholesterol, serum creatinine, platelet count, and red/white blood cell count.
- Citation: Bai XF, Wang H, Zhao QL. Hemoglobin within normal range is negatively related to hemoglobin A1c in a nondiabetic American population aged 16 years and older. World J Diabetes 2022; 13(3): 251-259
- URL: https://www.wjgnet.com/1948-9358/full/v13/i3/251.htm
- DOI: https://dx.doi.org/10.4239/wjd.v13.i3.251


