Copyright
©The Author(s) 2022.
World J Diabetes. Feb 15, 2022; 13(2): 110-125
Published online Feb 15, 2022. doi: 10.4239/wjd.v13.i2.110
Published online Feb 15, 2022. doi: 10.4239/wjd.v13.i2.110
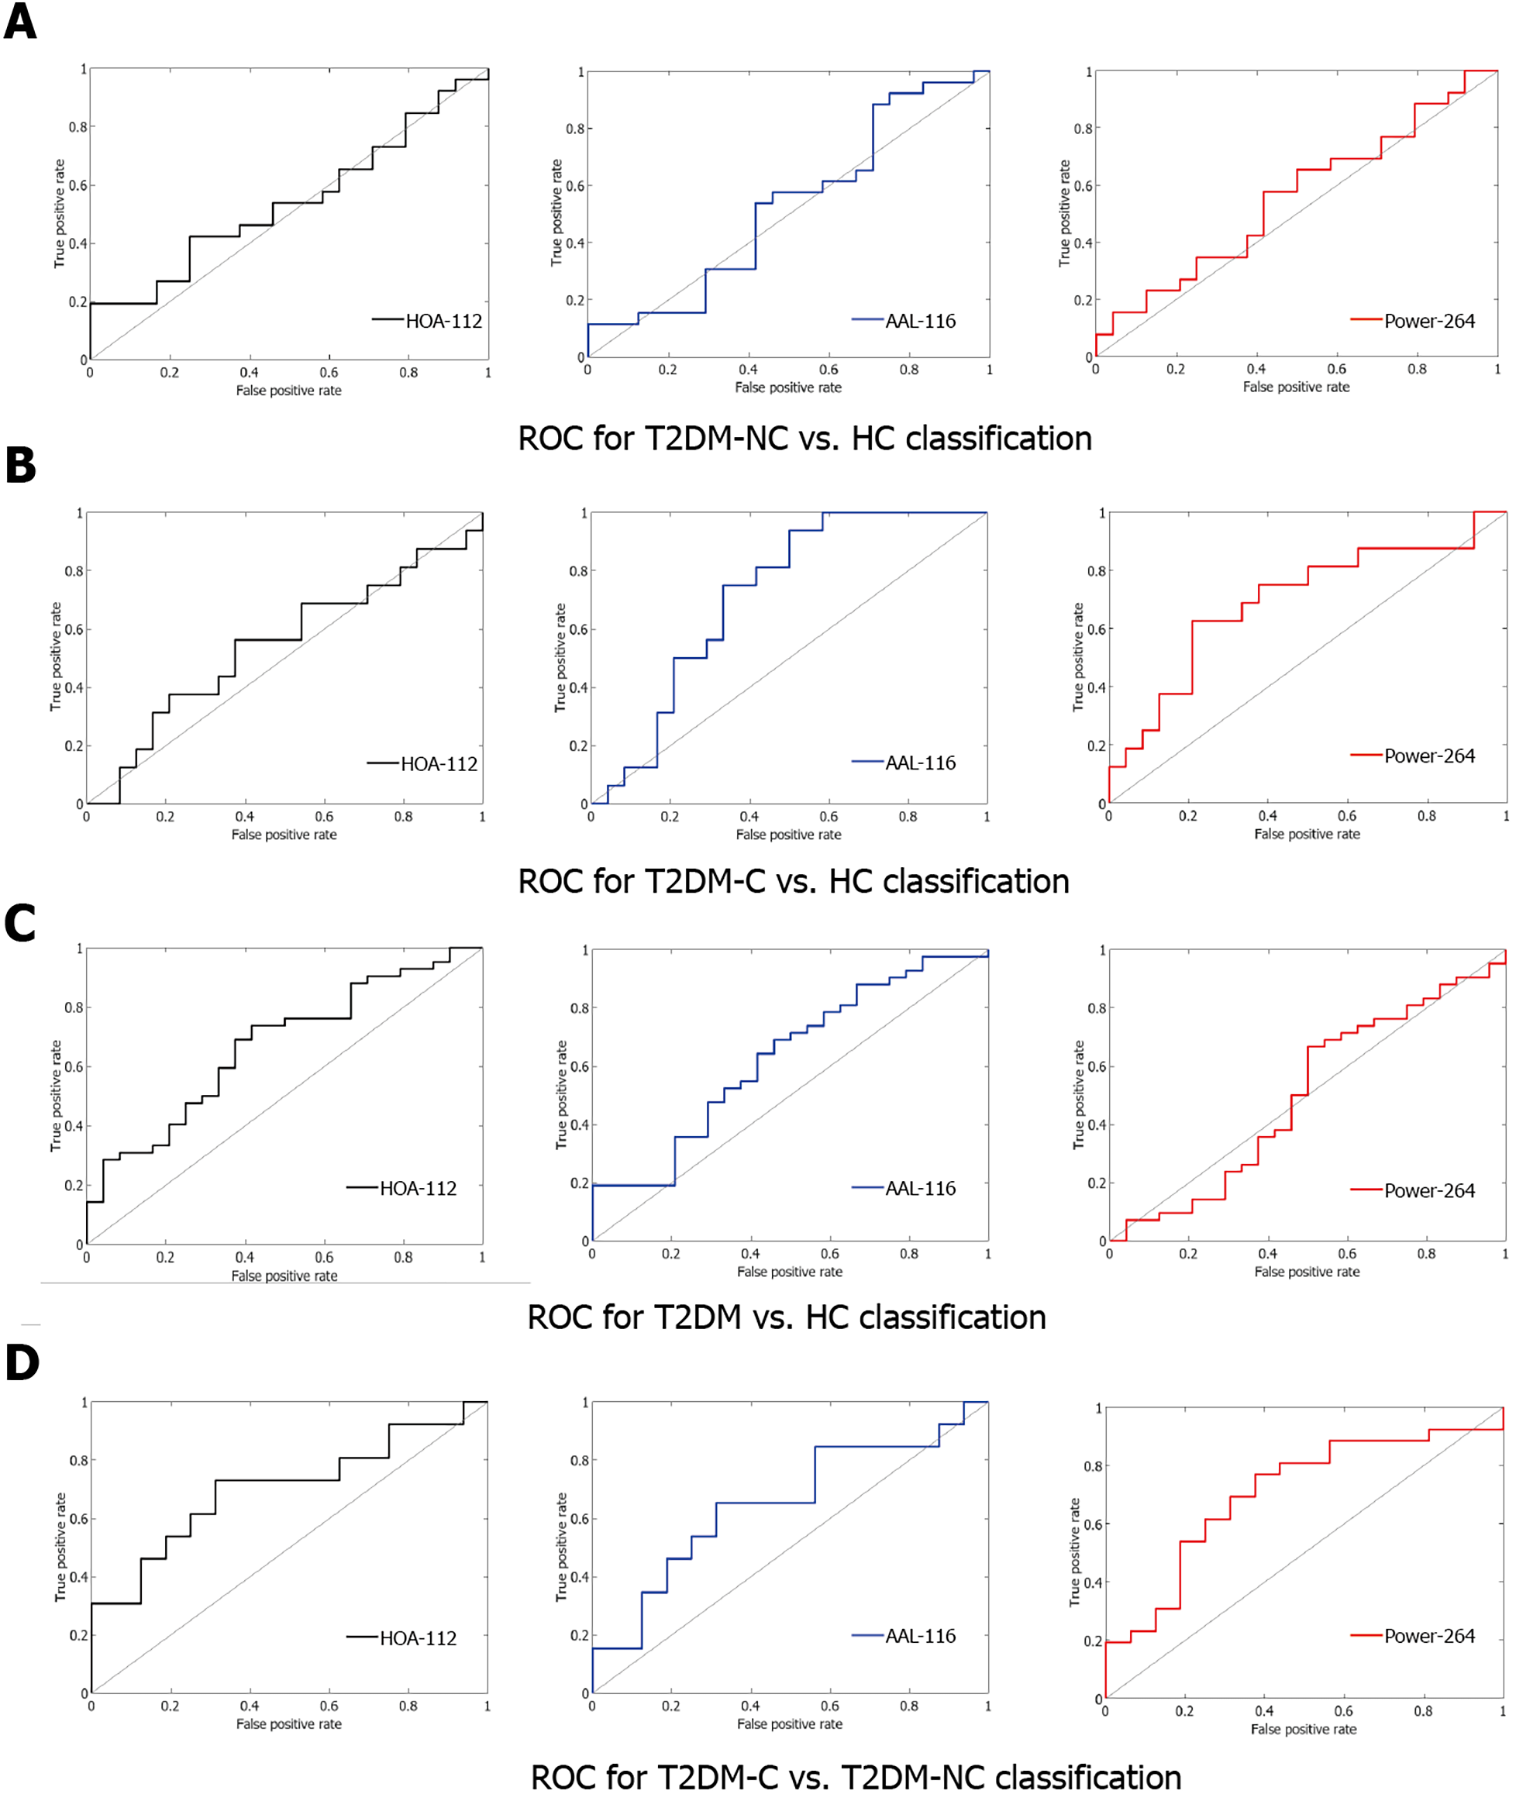
Figure 4 Classification efficiency of support vector machine based on three atlases.
The classification effect was not very ideal. A: The area under curve (AUC) value of patients with type 2 diabetes mellitus (T2DM) with the absence of mild cognitive impairment (T2DM-NC) Verus healthy controls (HC) group was 0.54 [Harvard Oxford (HOA-112) atlas], 0.53 [Automated Anatomical Labeling (AAL-116) atlas], 0.56 [264-region functional (Power-264) atlas]; B: the AUC value of patients with T2DM with the presence of mild cognitive impairment (T2DM-C) Verus HC group was 0.54 (HOA-112 atlas), 0.72 (AAL-116 atlas), 0.70 (Power-264 atlas); C: the AUC value of T2DM Verus HC group was 0.67 (HOA-112 atlas), 0.63 (AAL-116 atlas), 0.50 (Power-264 atlas); D: the AUC value of T2DM-C Verus T2DM-NC group was 0.70 (HOA-112 atlas and Power-264 atlas), 0.65(AAL-116 atlas). ROC: receiver operating characteristic curve.
- Citation: Shi AP, Yu Y, Hu B, Li YT, Wang W, Cui GB. Large-scale functional connectivity predicts cognitive impairment related to type 2 diabetes mellitus. World J Diabetes 2022; 13(2): 110-125
- URL: https://www.wjgnet.com/1948-9358/full/v13/i2/110.htm
- DOI: https://dx.doi.org/10.4239/wjd.v13.i2.110


