Copyright
©The Author(s) 2021.
World J Diabetes. Sep 15, 2021; 12(9): 1576-1586
Published online Sep 15, 2021. doi: 10.4239/wjd.v12.i9.1576
Published online Sep 15, 2021. doi: 10.4239/wjd.v12.i9.1576
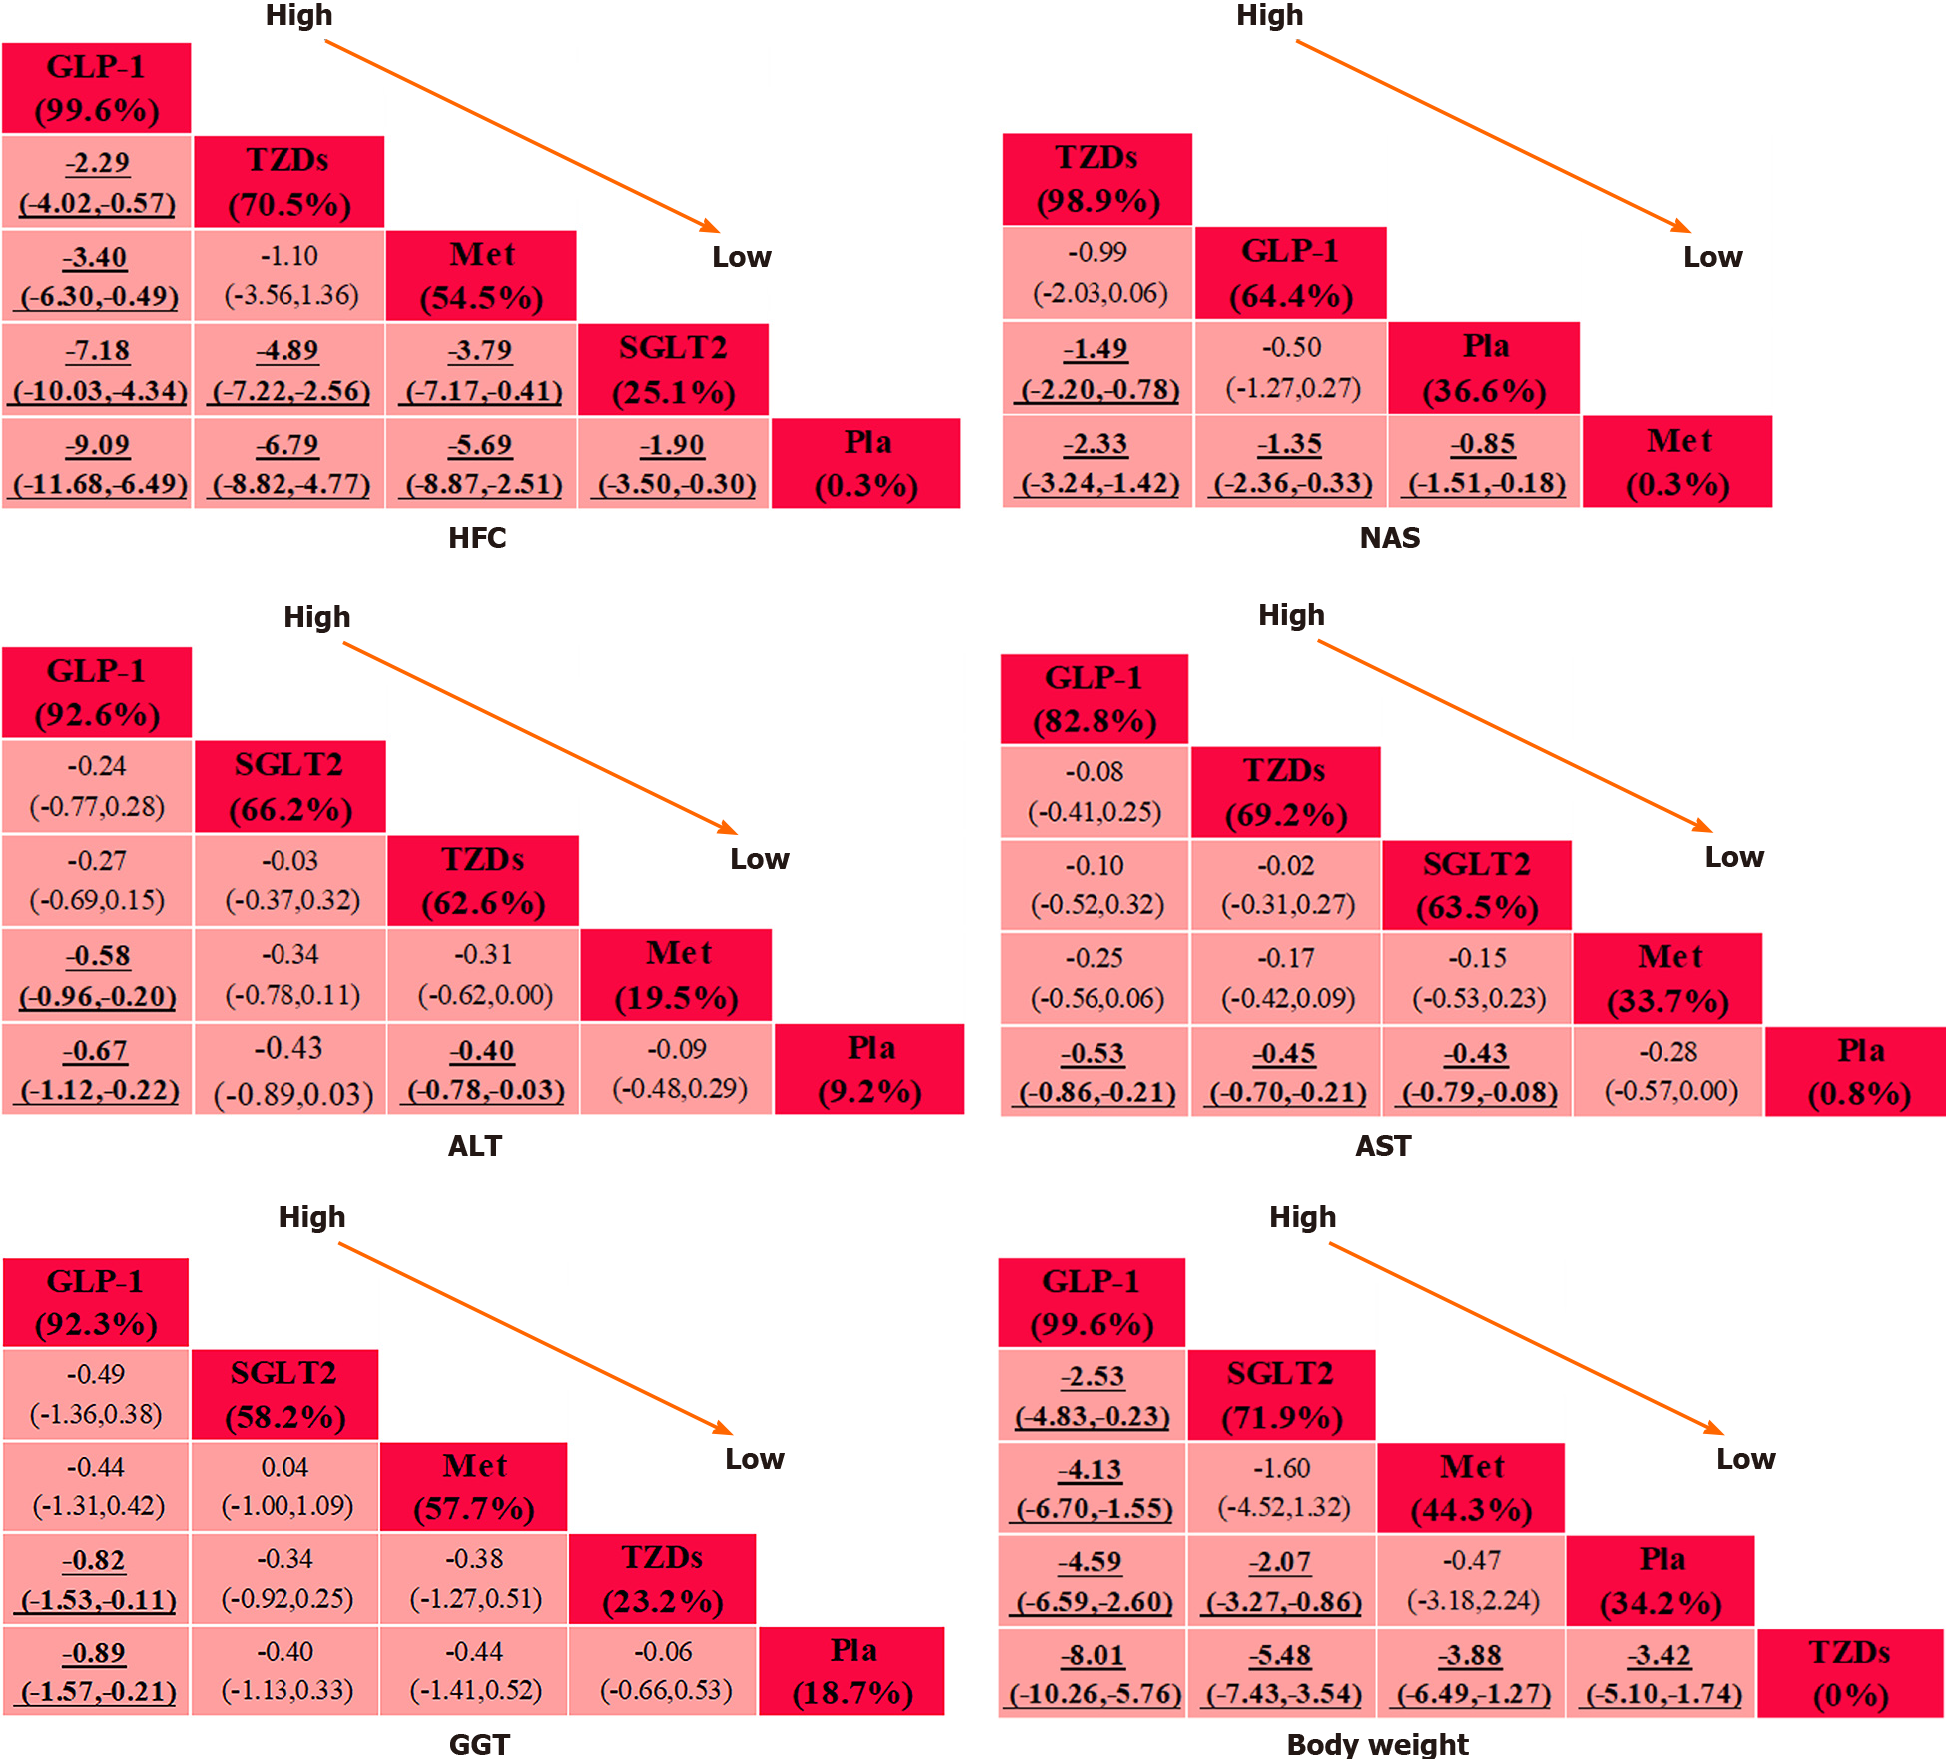
Figure 3 Relative effects of various outcomes.
Treatments are ranked according to their chance of being the best treatment. “High” means the highest probability of being the best treatment, and “Low” means the lowest probability of being the best treatment. Numbers in the crimson boxes are the SUCRA (surface under the cumulative ranking curve) values, which represent the level of treatment. The higher the value, the greater the probability of being the best intervention. Significant pairwise comparisons are highlighted in bold and underlined. GLP-1: Glucagon-like peptide-1 receptor agonists; TZDs: Thiazolidinediones; Met: Metformin; SGLT2: Sodium glucose cotransporter-2 inhibitors; Pla: Placebo; HFC: Hepatic fat content; NAS: Nonalcoholic fatty liver disease activity score; ALT: Alanine aminotransferase; AST: Aspartate aminotransferase; GGT: Serum γ-glutamyl transferase.
- Citation: Huang YZ, Yang GY, Wang C, Chen XY, Zhang LL. Effectiveness of drug interventions in nonalcoholic fatty liver disease: A network meta-analysis. World J Diabetes 2021; 12(9): 1576-1586
- URL: https://www.wjgnet.com/1948-9358/full/v12/i9/1576.htm
- DOI: https://dx.doi.org/10.4239/wjd.v12.i9.1576


