Copyright
©The Author(s) 2021.
World J Diabetes. Aug 15, 2021; 12(8): 1292-1303
Published online Aug 15, 2021. doi: 10.4239/wjd.v12.i8.1292
Published online Aug 15, 2021. doi: 10.4239/wjd.v12.i8.1292
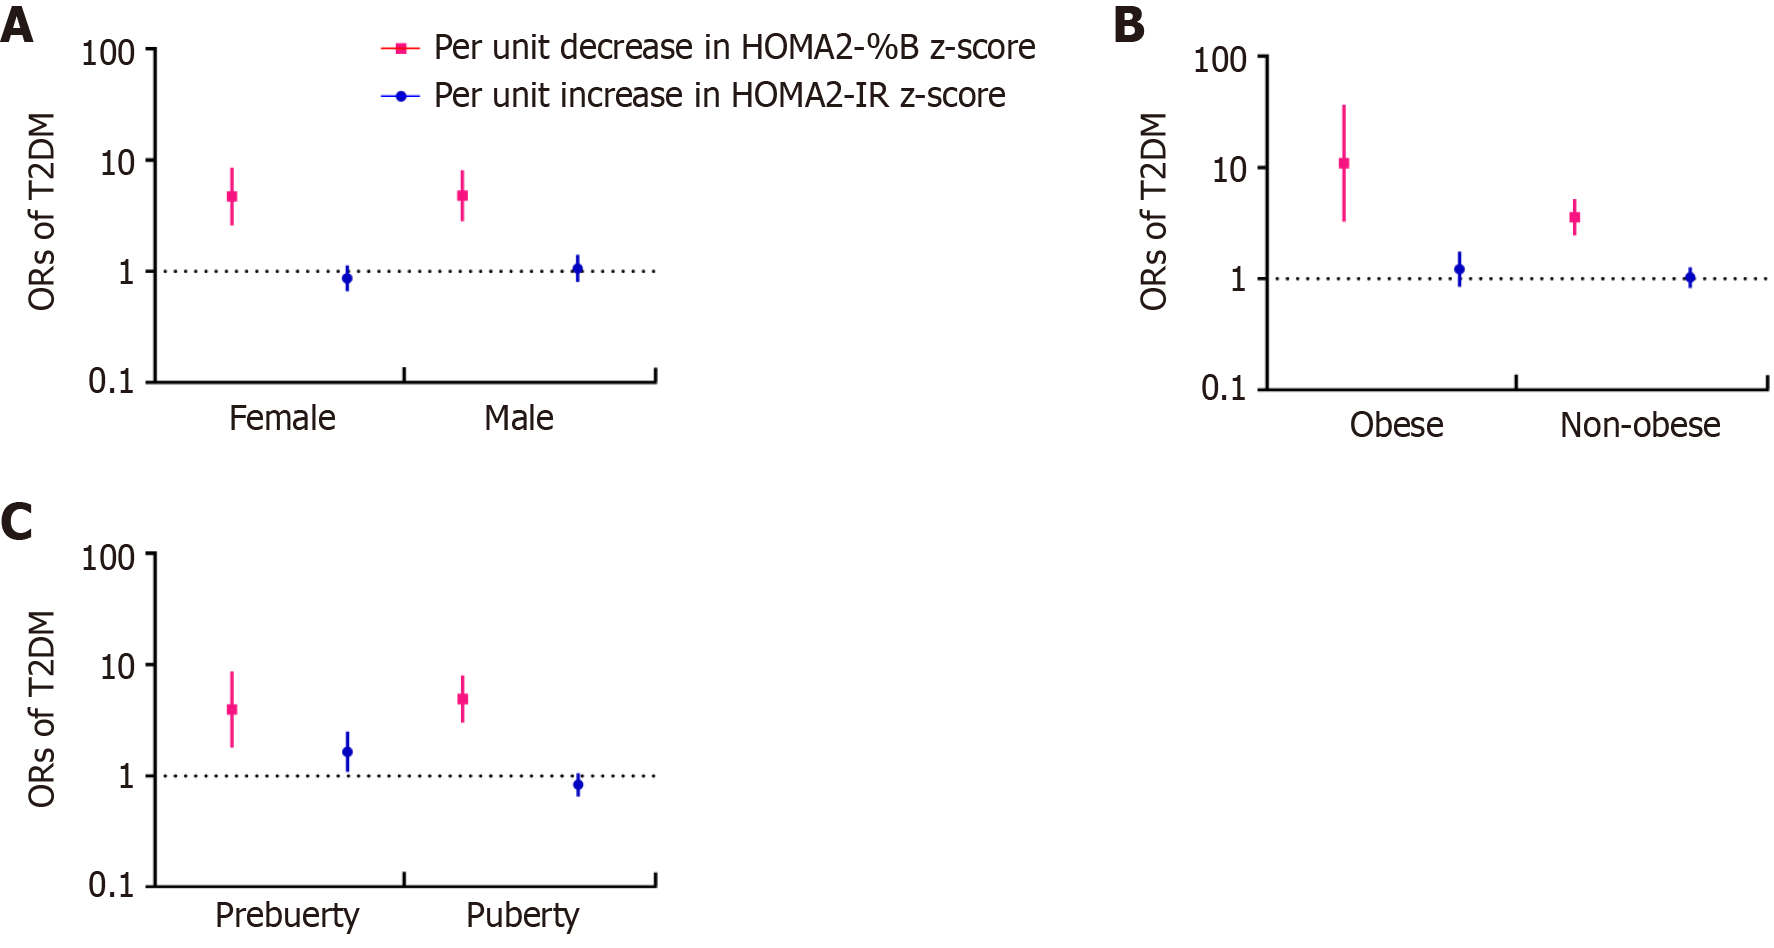
Figure 3 Association of changes in the homeostasis model index with risk of type 2 diabetes by sex, obesity status, and puberty status.
Error bars indicate 95%CIs. Red squares represent the association of per unit decrease in homeostasis model assessment of β-cell function z-score with type 2 diabetes mellitus (T2DM). Blue circles represent the association of per unit increase in homeostasis model assessment of insulin resistance z-score with T2DM. A: Age, Tanner stage, T2DM family history, body mass index (BMI) z-score, and lipid profile were adjusted; B: Sex, age, Tanner stage, T2DM family history, and lipid profile were adjusted; C: Sex, age, T2DM family history, BMI z-score, and lipid profile were adjusted. T2DM: Type 2 diabetes mellitus; HOMA2-%B: Homeostasis model assessment of β-cell function; HOMA2-IR: Homeostasis model assessment of insulin resistance.
- Citation: Xu ZR, Du HW, Cui LW, Zheng RX, Li GM, Wei HY, Lu FY, Chen LL, Wu CS, Zhang SX, Zhang SL, Liu F, Zhang MY, Pei Z, Sun CJ, Wu J, Luo FH. Association of β-cell function and insulin resistance with pediatric type 2 diabetes among Chinese children. World J Diabetes 2021; 12(8): 1292-1303
- URL: https://www.wjgnet.com/1948-9358/full/v12/i8/1292.htm
- DOI: https://dx.doi.org/10.4239/wjd.v12.i8.1292


