Copyright
©The Author(s) 2021.
World J Diabetes. Aug 15, 2021; 12(8): 1292-1303
Published online Aug 15, 2021. doi: 10.4239/wjd.v12.i8.1292
Published online Aug 15, 2021. doi: 10.4239/wjd.v12.i8.1292
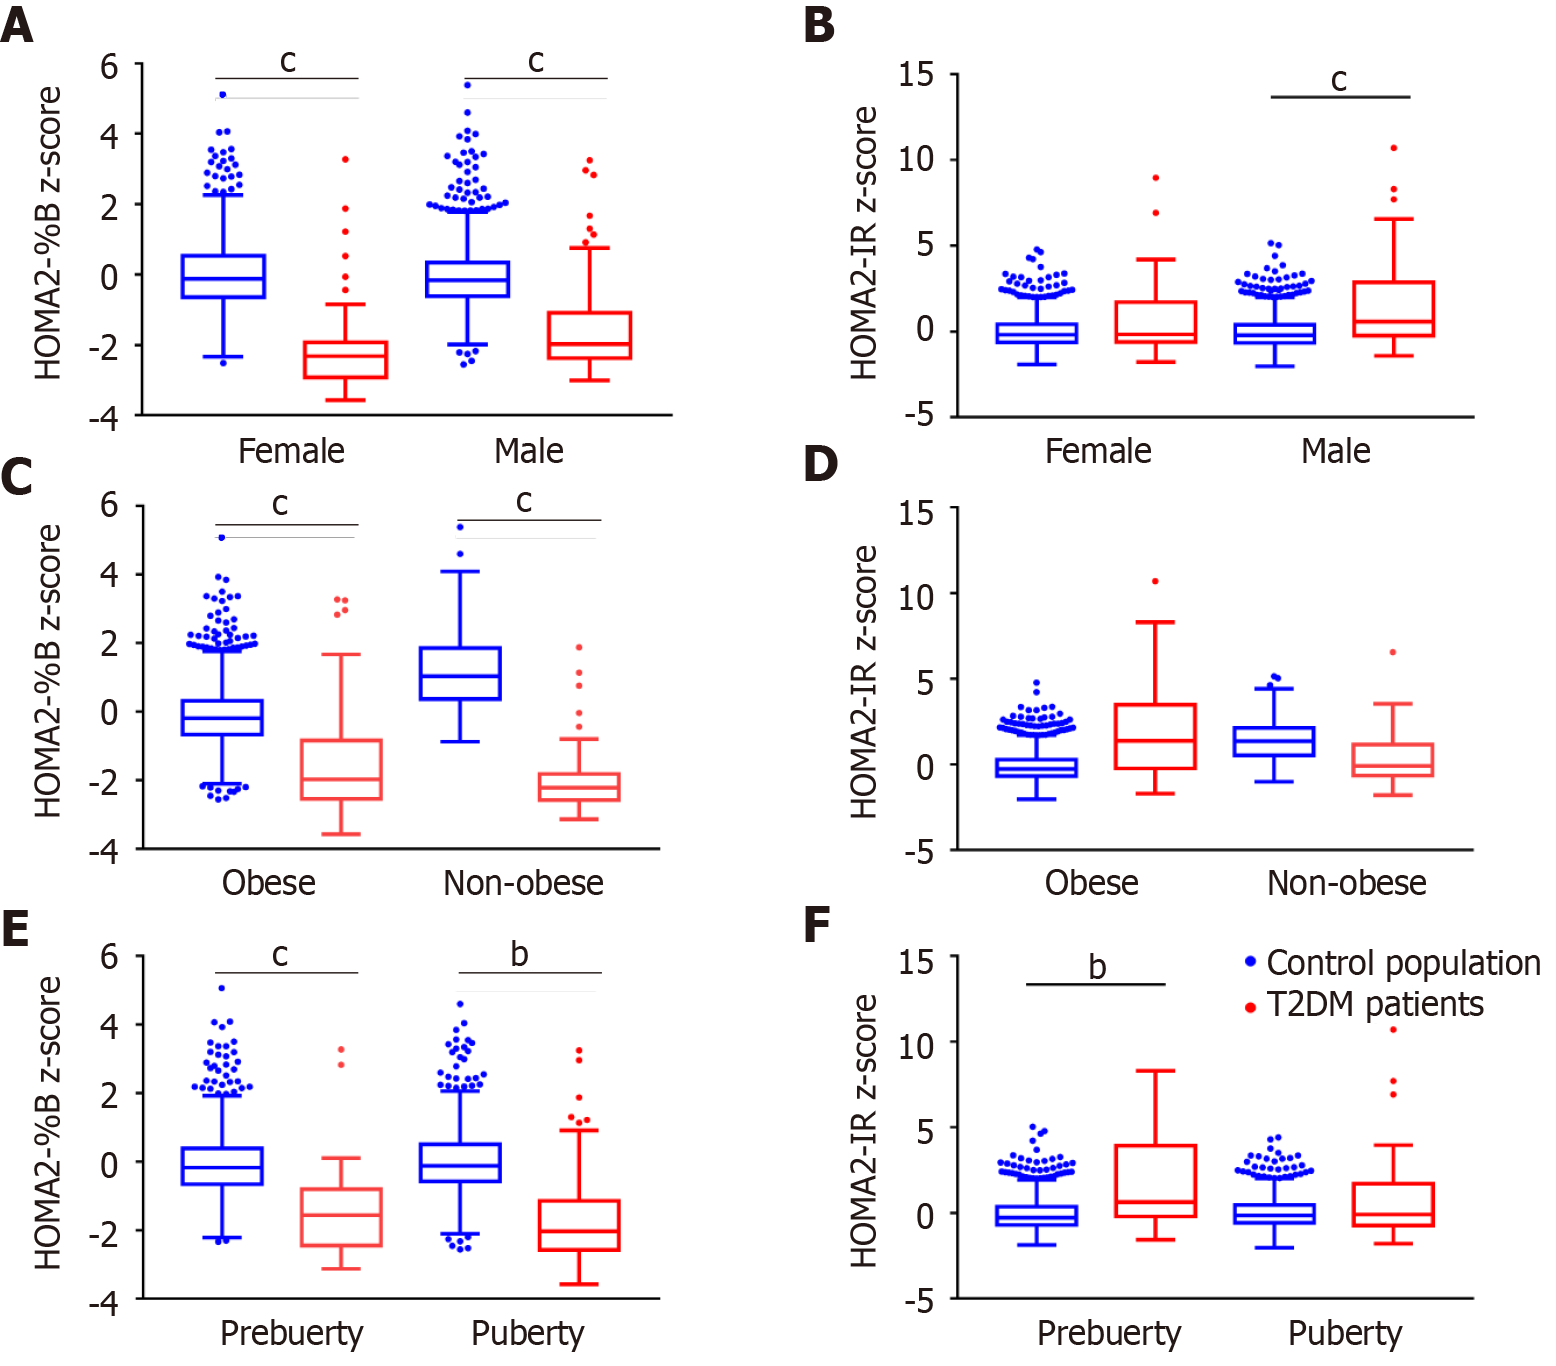
Figure 2 Differences in z-scores of homeostasis model assessment of β-cell function and insulin resistance between type 2 diabetes patients and the control population.
The box plots show the median (horizontal line), interquartile range (box), 5th percentiles (whiskers), 95th percentiles (whiskers), and outliers outside the 5th and 95th percentiles (dots). Red boxes represent type 2 diabetes patients and blue boxes represent the control population. Z-scores of the homeostasis model index were compared between the type 2 diabetes patients and the control population by sex (A and B), obesity status (C and D) and puberty status (E and F). bP < 0.01, cP < 0.001. T2DM: Type 2 diabetes mellitus; HOMA2-%B: Homeostasis model assessment of β-cell function; HOMA2-IR: Homeostasis model assessment of insulin resistance.
- Citation: Xu ZR, Du HW, Cui LW, Zheng RX, Li GM, Wei HY, Lu FY, Chen LL, Wu CS, Zhang SX, Zhang SL, Liu F, Zhang MY, Pei Z, Sun CJ, Wu J, Luo FH. Association of β-cell function and insulin resistance with pediatric type 2 diabetes among Chinese children. World J Diabetes 2021; 12(8): 1292-1303
- URL: https://www.wjgnet.com/1948-9358/full/v12/i8/1292.htm
- DOI: https://dx.doi.org/10.4239/wjd.v12.i8.1292


