Copyright
©The Author(s) 2021.
World J Diabetes. Aug 15, 2021; 12(8): 1267-1281
Published online Aug 15, 2021. doi: 10.4239/wjd.v12.i8.1267
Published online Aug 15, 2021. doi: 10.4239/wjd.v12.i8.1267
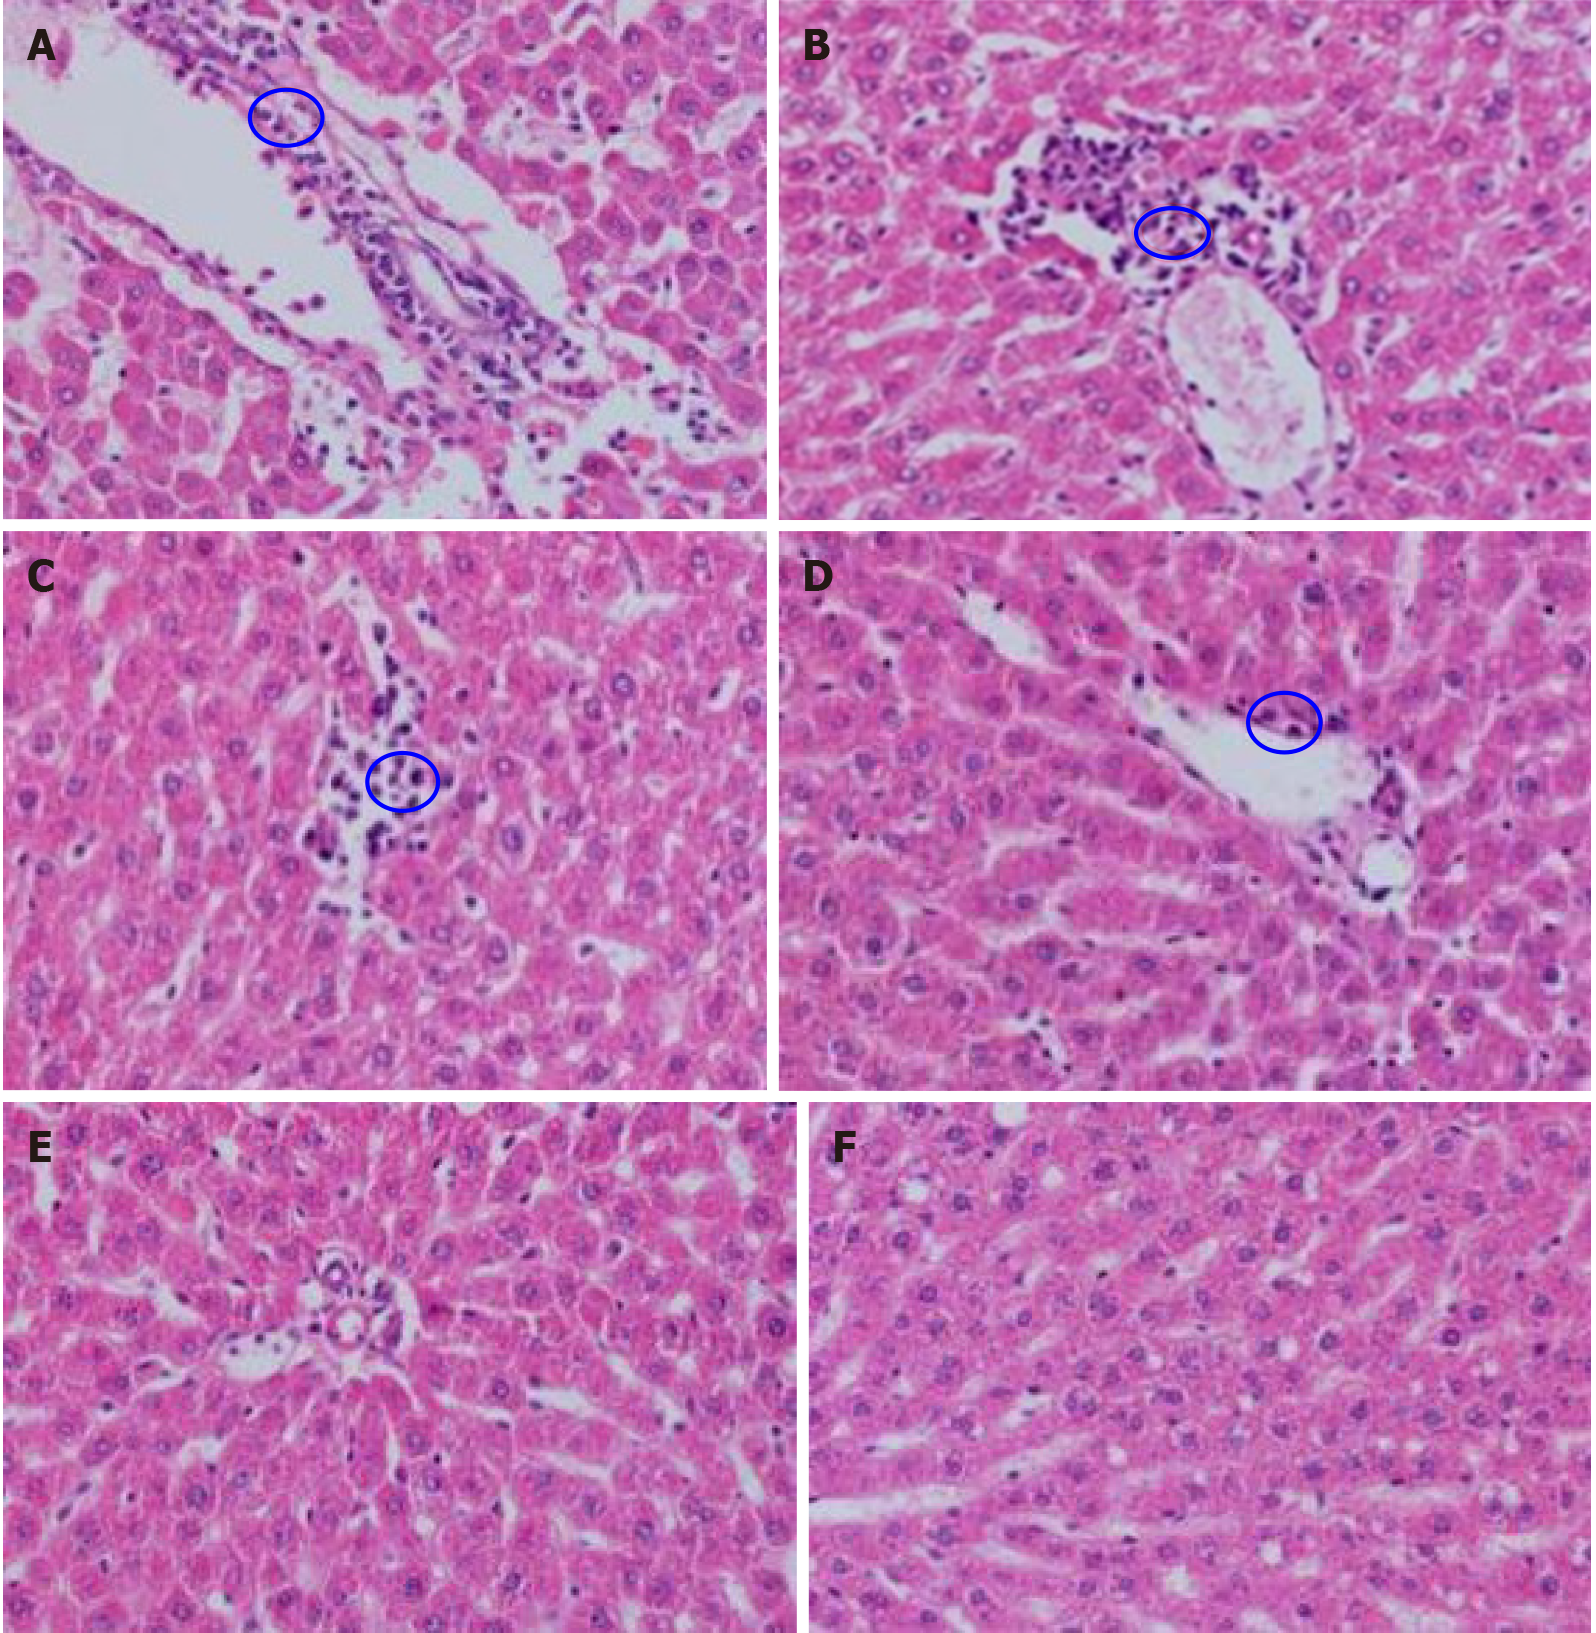
Figure 3 Effect of decabromodiphenyl ether on mouse liver tissue morphology (Hematoxylin and eosin, × 400).
A: High dose group; B: Medium-high dose group; C: Medium dose group; D: Medium-low dose group; E: Low dose group; and F: Control group. The red circles refer to the inflammatory cells.
- Citation: Alimu A, Abudureman H, Wang YZ, Li MY, Wang JS, Liu ZL. Decabromodiphenyl ether causes insulin resistance and glucose and lipid metabolism disorders in mice. World J Diabetes 2021; 12(8): 1267-1281
- URL: https://www.wjgnet.com/1948-9358/full/v12/i8/1267.htm
- DOI: https://dx.doi.org/10.4239/wjd.v12.i8.1267


