Copyright
©The Author(s) 2021.
World J Diabetes. Jul 15, 2021; 12(7): 1116-1130
Published online Jul 15, 2021. doi: 10.4239/wjd.v12.i7.1116
Published online Jul 15, 2021. doi: 10.4239/wjd.v12.i7.1116
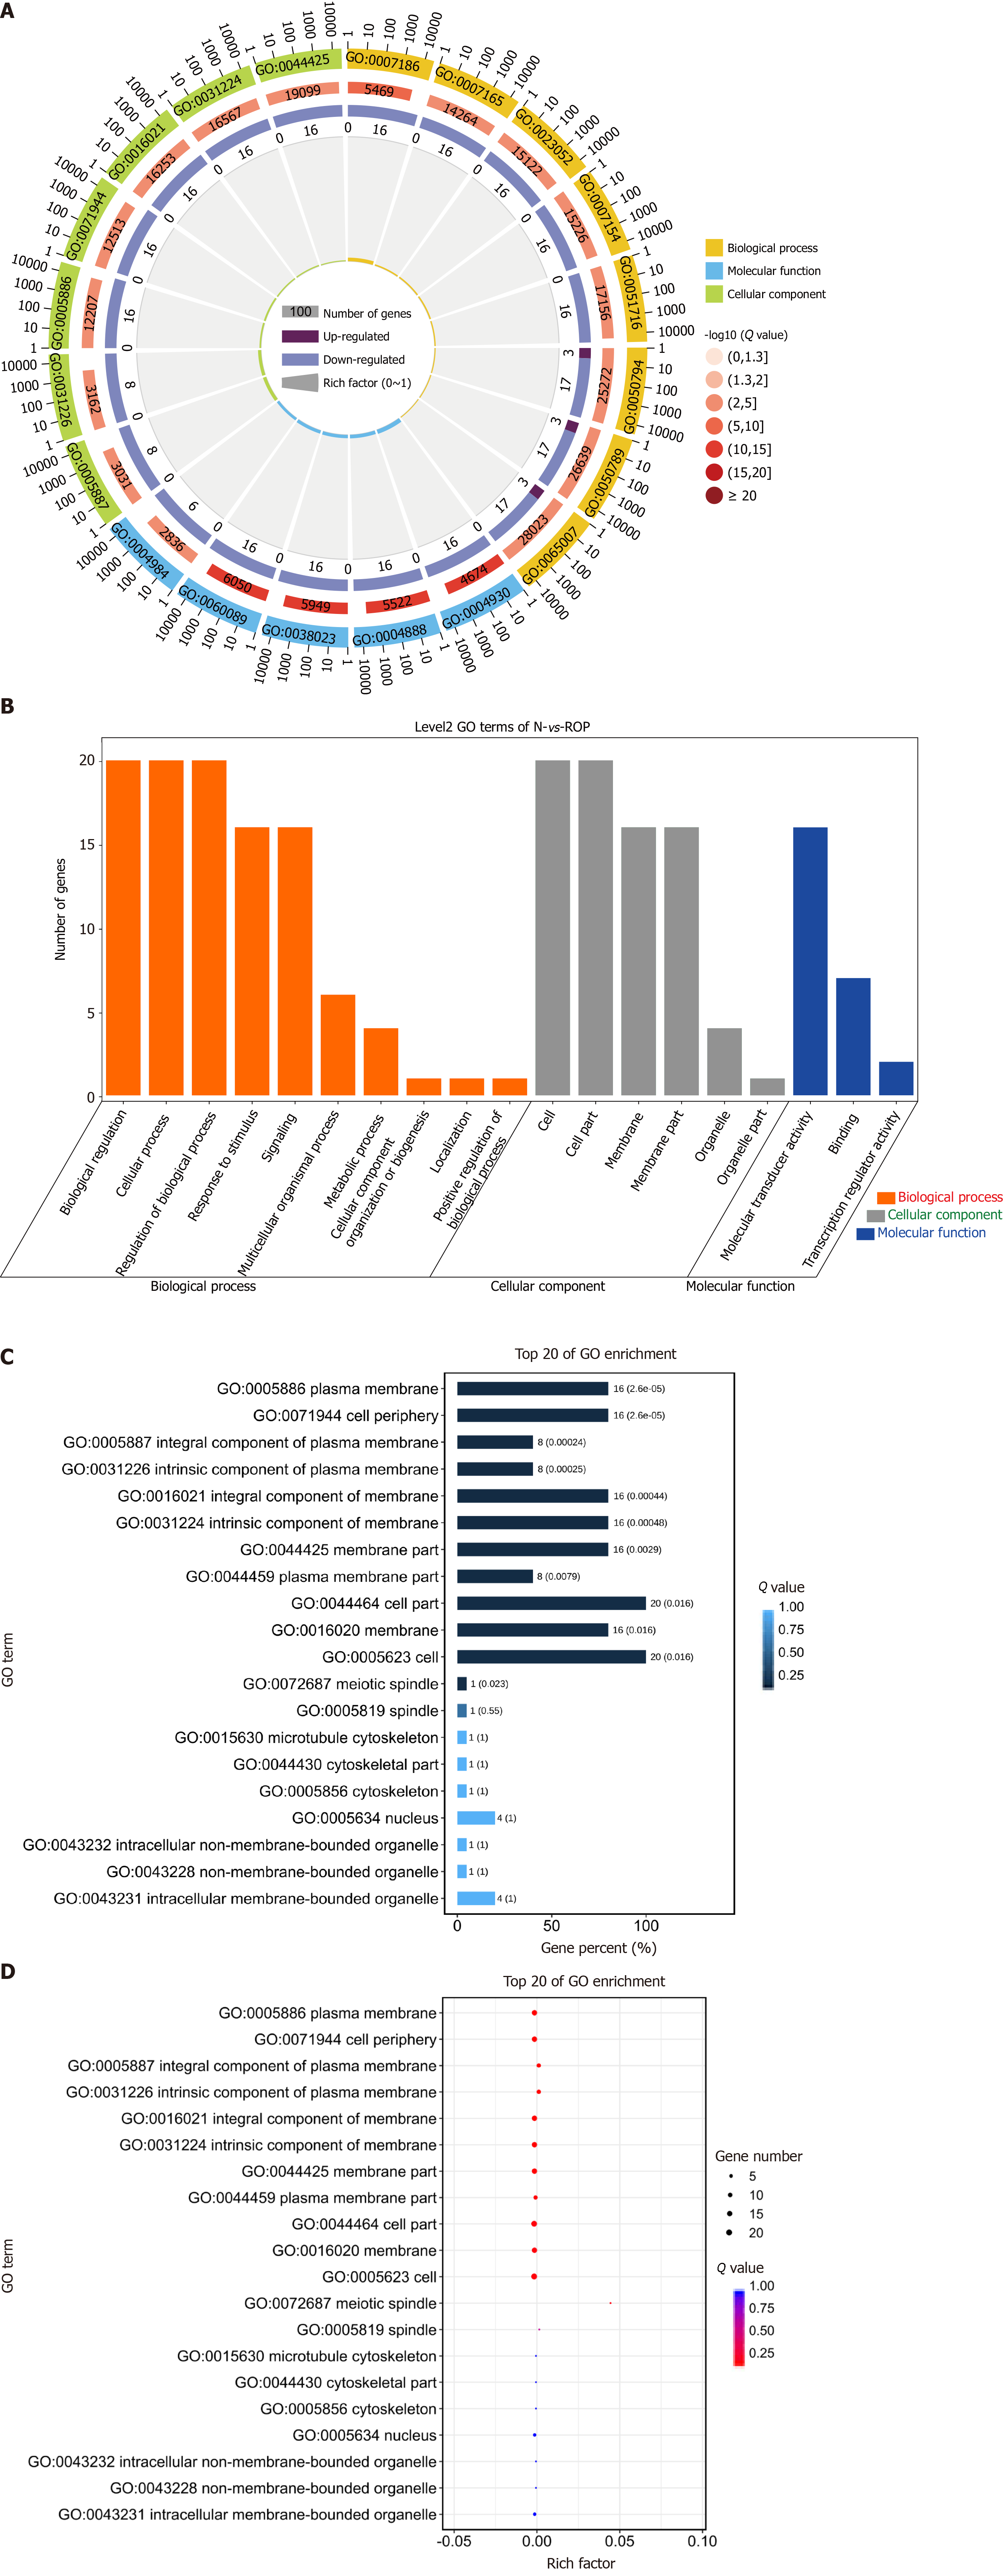
Figure 5 Gene Ontology analysis results.
A: Gene Ontology (GO) enrichment circle diagram (first circle: top 20 GO terms, the coordinate scale of gene number is presented outside the circle. Second circle: number and Q value of the GO term in the background gene. Third circle: number of GO term piRNA target genes. Fourth circle: rich factor value of each GO term piRNA); B: Bar graph of GO enrichment (abscissa shows the level 2 GO term, whereas the ordinate shows the number of genes in the term); C: Bar graph of GO enrichment (a darker color, results in a smaller Q value; the value in the column is the number and Q value of the GO term); D: GO enrichment bubble chart (size indicates the quantity; a redder color leads to a smaller Q value).
- Citation: Yu Y, Ren KM, Chen XL. Expression and role of P-element-induced wimpy testis-interacting RNA in diabetic-retinopathy in mice. World J Diabetes 2021; 12(7): 1116-1130
- URL: https://www.wjgnet.com/1948-9358/full/v12/i7/1116.htm
- DOI: https://dx.doi.org/10.4239/wjd.v12.i7.1116


