Copyright
©The Author(s) 2021.
World J Diabetes. Jul 15, 2021; 12(7): 1116-1130
Published online Jul 15, 2021. doi: 10.4239/wjd.v12.i7.1116
Published online Jul 15, 2021. doi: 10.4239/wjd.v12.i7.1116
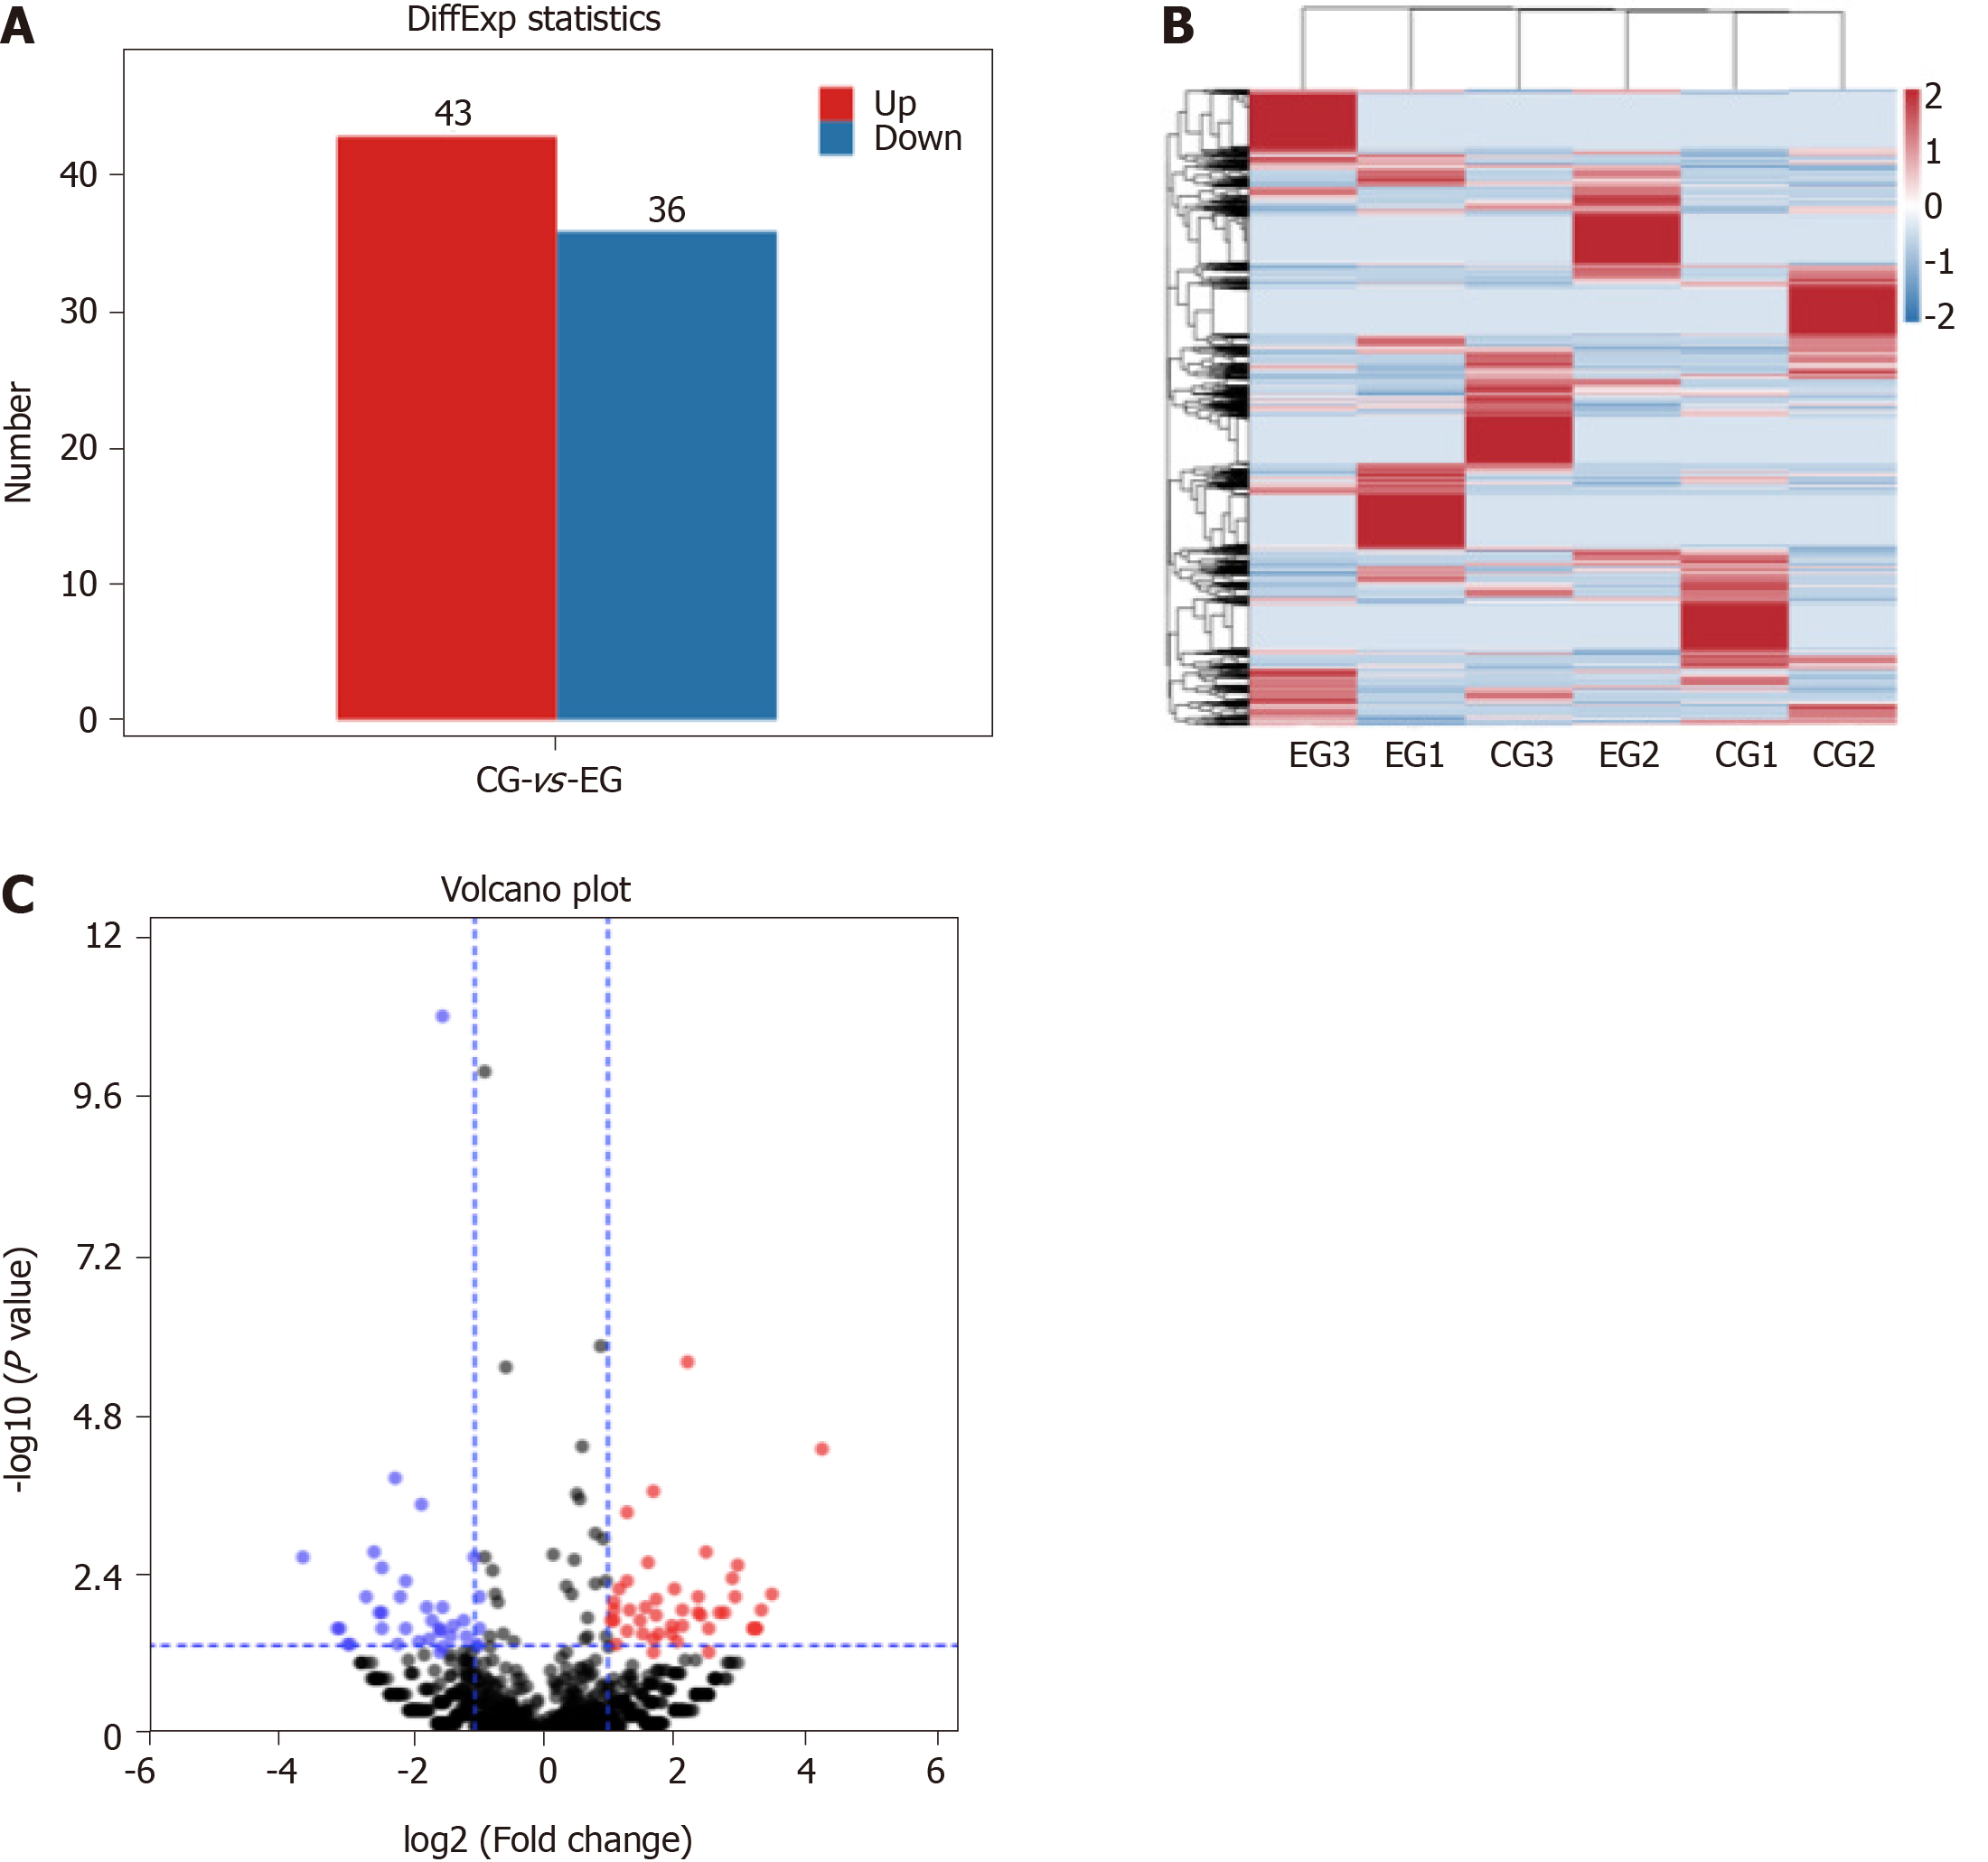
Figure 3 Screening results of differentially expressed genes.
A: Number of differentially expressed piRNAs between experimental group (EG) and control group (CG); B: Clustering analysis of differentially expressed piRNAs; C: Volcano map of differentially expressed piRNAs.
- Citation: Yu Y, Ren KM, Chen XL. Expression and role of P-element-induced wimpy testis-interacting RNA in diabetic-retinopathy in mice. World J Diabetes 2021; 12(7): 1116-1130
- URL: https://www.wjgnet.com/1948-9358/full/v12/i7/1116.htm
- DOI: https://dx.doi.org/10.4239/wjd.v12.i7.1116


