Copyright
©The Author(s) 2021.
World J Diabetes. Jul 15, 2021; 12(7): 1102-1115
Published online Jul 15, 2021. doi: 10.4239/wjd.v12.i7.1102
Published online Jul 15, 2021. doi: 10.4239/wjd.v12.i7.1102
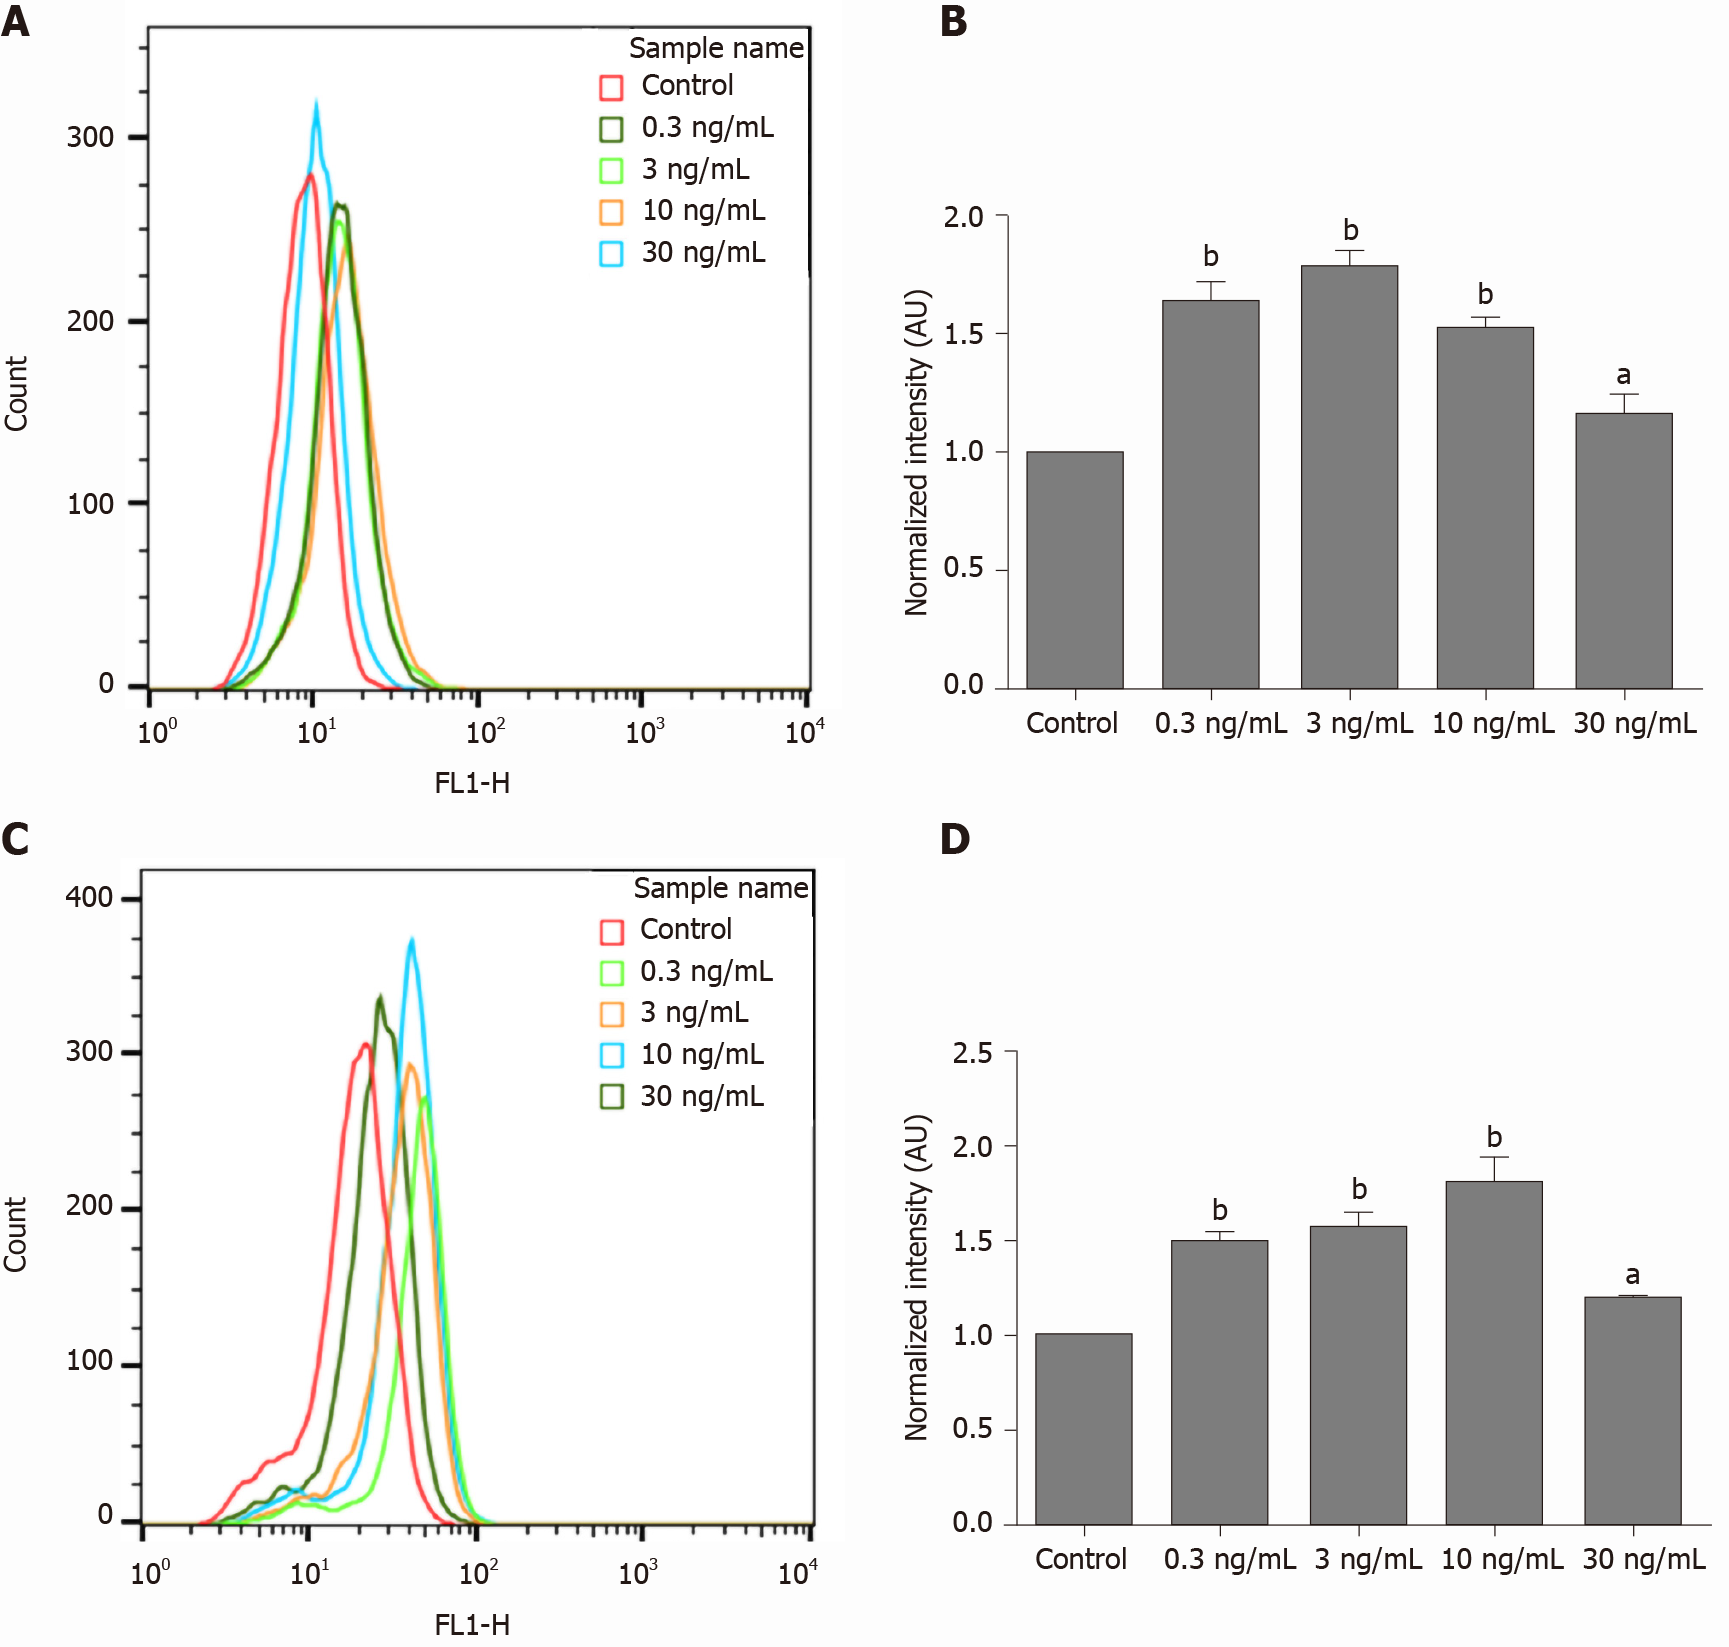
Figure 2 Flow cytometric analyses of 2-deoxy-2-[(7-nitro-2,1,3-benzoxadiazol-4-yl)amino]-D-glucose uptake by MG63 cells after decarboxylated osteocalcin stimulation.
A: The distribution of fluorescence intensities which represented 2-Deoxy-2-[(7-nitro-2,1,3-benzoxadiazol-4-yl)amino]-D-glucose (2-NBDG) uptake after decarboxylated osteocalcin (dcOC) stimulation for 1 h; B: The normalized fluorescence intensities corresponding to 2-NBDG uptake after dcOC stimulation for 1 h; C: Distribution of fluorescence intensities which represented 2-NBDG uptake after dcOC stimulation for 72 h; D: The normalized fluorescence intensity corresponding to 2-NBDG uptake after dcOC stimulation for 72 h. The red lines in the histograms in A and C indicate the control group (0 ng/mL), while the other lines indicate the groups treated with dcOC at different concentrations. The data are representative of three independent experiments performed in triplicate. aP < 0.05, bP < 0.01 vs the control group.
- Citation: Jin S, Chang XC, Wen J, Yang J, Ao N, Zhang KY, Suo LN, Du J. Decarboxylated osteocalcin, a possible drug for type 2 diabetes, triggers glucose uptake in MG63 cells. World J Diabetes 2021; 12(7): 1102-1115
- URL: https://www.wjgnet.com/1948-9358/full/v12/i7/1102.htm
- DOI: https://dx.doi.org/10.4239/wjd.v12.i7.1102


